커뮤니티
부탁 드립니다.

2017-07-23 21:42:22
185
글번호 111508
첨부 이미지
그림1

도움 주심에 경배로 감사 인사 드립니다.
질문1)
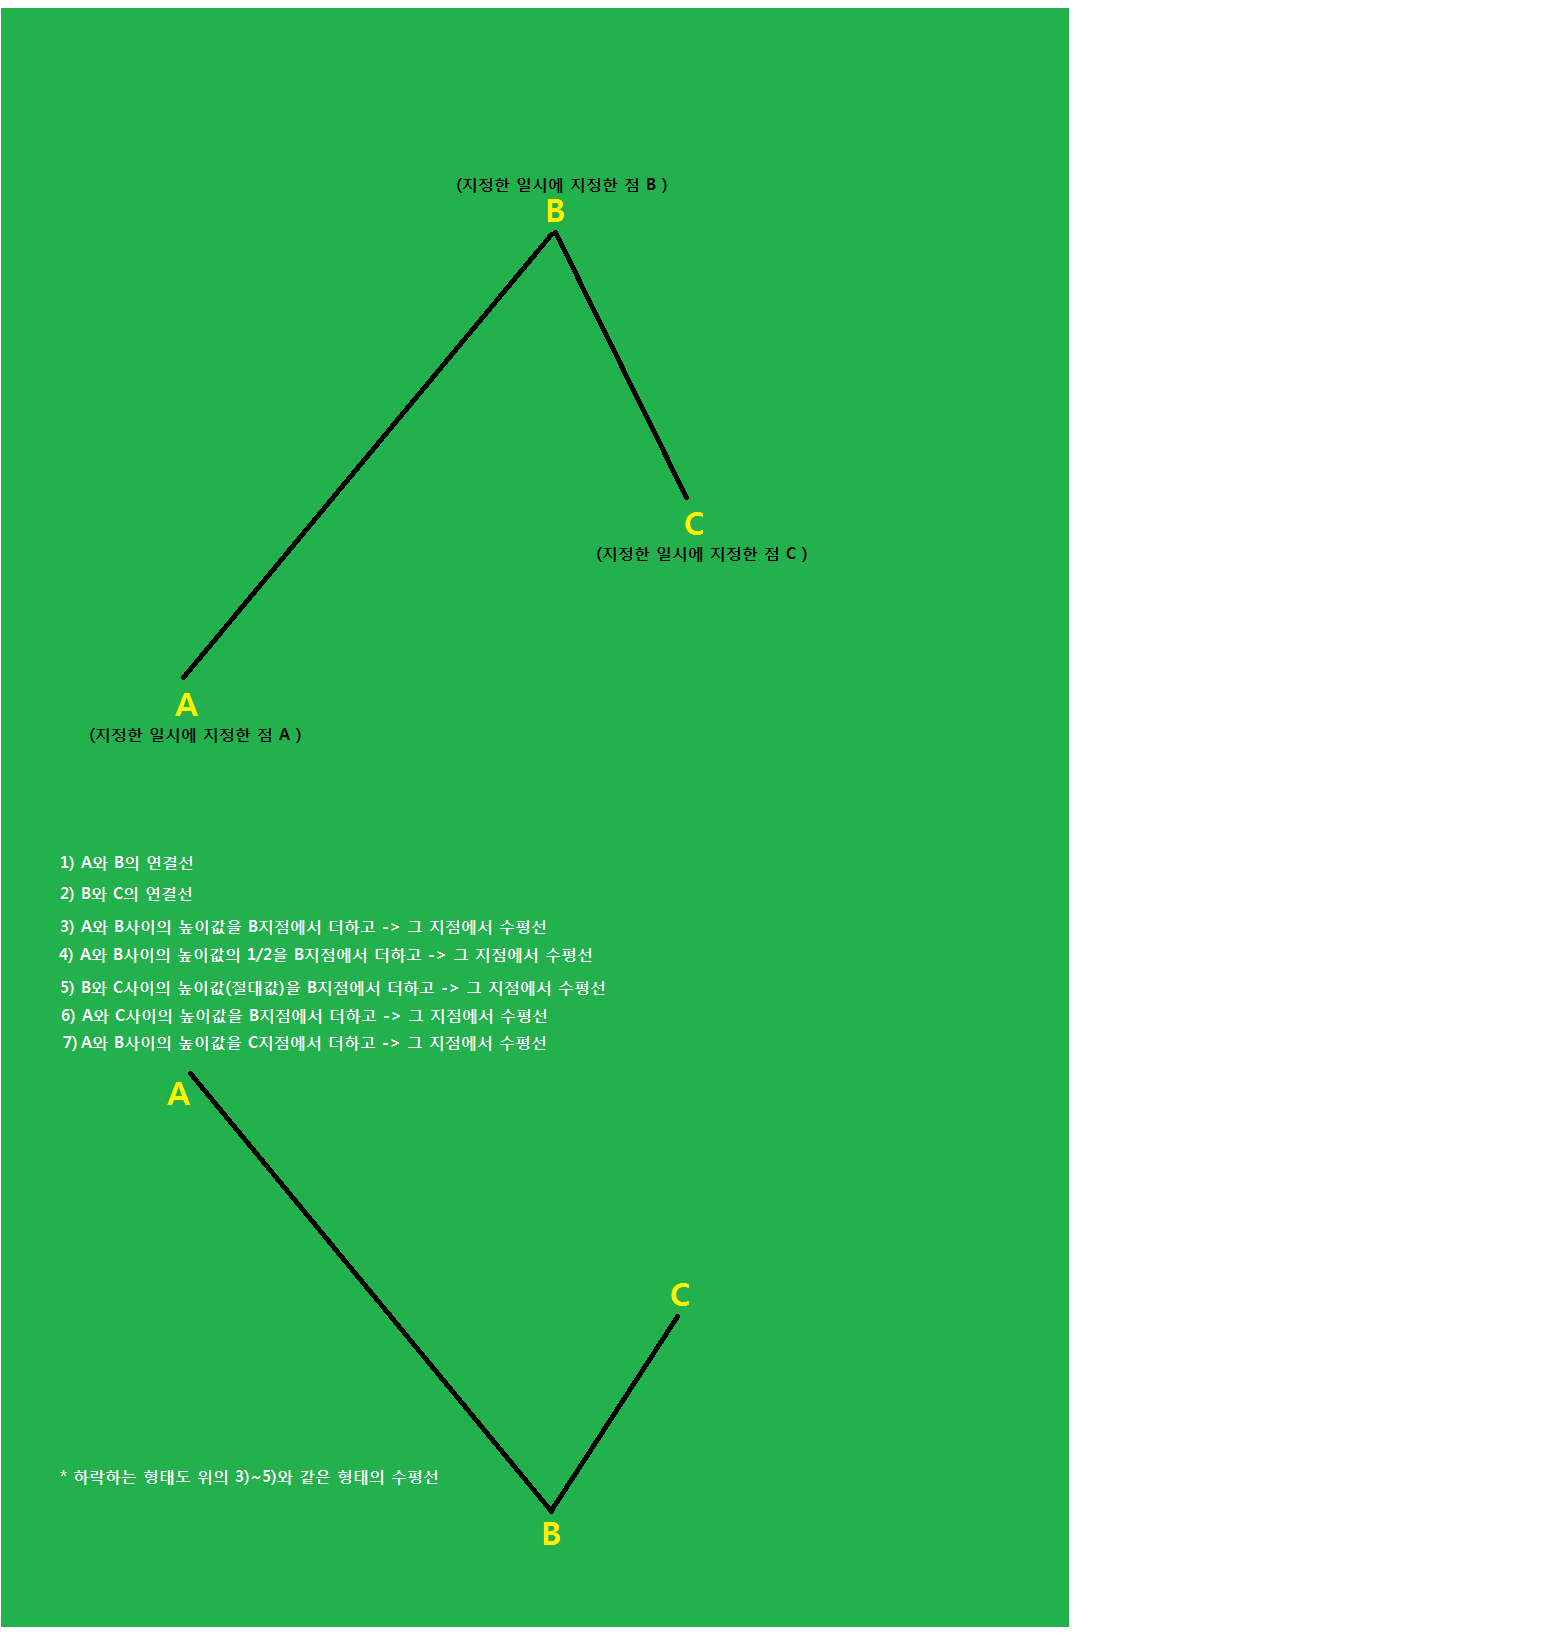
일시를 지정한 A,B,C, 세점을
연결한 선 등 첨부한 그림과 같이 부탁 드립니다.
질문2)
해선에서
p100으로 지정된 기간에 생성된 선이 길게 나타 날 경우
(당일을 초과하여 다음날로 연장될 경우)
06:00에는 정지하여
그선이 다음날(07:00 이후) 에는 나타나지 않게 가능 하겠는지요?
(var13 != Hv3, var33 != hv3->를 사용하지 않는 수식으로)
input : p100(30);
var : HV1(0),HV2(0),HV3(0);
var : HH1(0),HH2(0),HH3(0);
var : LL1(0),LL2(0),LL3(0);
HV1=NthHighest(1,v,p100);
HV2=nthhighest(2,v,p100);
HV3=nthhighest(3,v,p100);
HH1=NthHighest(1,h,p100);
HH2=nthhighest(2,h,p100);
HH3=nthhighest(3,h,p100);
LL1=NthLowest(1,L,P100);
LL2=NTHLOWEST(2,L,P100);
LL3=NTHLOWEST(3,L,P100);
if Hv3 > 0 and v == Hv3 and
((Hh1 > 0 and h == Hh1) or
(Hh2 > 0 and h == Hh2) or
(Hh3 > 0 and h == Hh3)) Then{
Condition3 = true;
var13 = H;
}
//if Condition3 == true and var13 != Hv3 Then
// Condition3 = false;
#########################################################
if Hv3 > 0 and v == Hv3 and
((LL1 > 0 and L == LL1) or
(LL2 > 0 and L == LL2) or
(LL3 > 0 and L == LL3)) Then{
Condition33 = true;
var33 = L;
}
//if Condition33 == true and var33 != hv3 Then
// Condition33 = false;
############################################
if Condition3 == true then{
plot3(var13,"H3",blue,def,0);
}
if Condition33 == true then{
plot33(var33,"L3",blue,def,0);
}
- 1. QQ11.png (0.05 MB)
답변 1

예스스탁 예스스탁 답변
2017-07-24 14:49:17
안녕하세요
예스스탁입니다.
1
지정한 그림에서 6번과 7번은 같은 값입니다.
7번은 식은 추가했습니다. 6번과 값이 다를때만 출력하게 했습니다.
input : dateA(20170703),timeA(90000);
input : dateB(20170710),timeB(90000);
input : dateC(20170717),timeC(90000);
var : AA(0),BB(0),CC(0);
if sdate == dateA and stime == timeA then
AA = 310;
if sdate == dateB and stime == timeB then
BB = 315;
if sdate == dateC and stime == timeC then{
CC = 312;
TL_New(dateA,timeA,AA,dateB,timeB,BB);
TL_New(dateB,timeB,BB,dateC,timeC,CC);
if BB > max(AA,CC) then{
TL_New(dateA,timeA,BB+abs(BB-AA),dateC,timeC,BB+abs(BB-AA));
TL_New(dateA,timeA,BB+abs(BB-AA)/2,dateC,timeC,BB+abs(BB-AA)/2);
TL_New(dateA,timeA,BB+abs(BB-CC),dateC,timeC,BB+abs(BB-CC));
TL_New(dateA,timeA,BB+abs(CC-AA),dateC,timeC,BB+abs(CC-AA));
if BB+abs(CC-AA) != CC+abs(BB-AA) then
TL_New(dateA,timeA,CC+abs(BB-AA),dateC,timeC,CC+abs(BB-AA));
}
if BB < min(AA,CC) then{
TL_New(dateA,timeA,BB-abs(BB-AA),dateC,timeC,BB-abs(BB-AA));
TL_New(dateA,timeA,BB-abs(BB-AA)/2,dateC,timeC,BB-abs(BB-AA)/2);
TL_New(dateA,timeA,BB-abs(BB-CC),dateC,timeC,BB-abs(BB-CC));
TL_New(dateA,timeA,BB-abs(CC-AA),dateC,timeC,BB-abs(CC-AA));
if BB-abs(CC-AA) != CC-abs(BB-AA) then
TL_New(dateA,timeA,CC-abs(BB-AA),dateC,timeC,CC-abs(BB-AA));
}
}
2
input : p100(30);
var : HV1(0),HV2(0),HV3(0);
var : HH1(0),HH2(0),HH3(0);
var : LL1(0),LL2(0),LL3(0);
HV1=NthHighest(1,v,p100);
HV2=nthhighest(2,v,p100);
HV3=nthhighest(3,v,p100);
HH1=NthHighest(1,h,p100);
HH2=nthhighest(2,h,p100);
HH3=nthhighest(3,h,p100);
LL1=NthLowest(1,L,P100);
LL2=NTHLOWEST(2,L,P100);
LL3=NTHLOWEST(3,L,P100);
if bdate != bdate[1] Then{
Condition3 = false;
Condition33 = false;
}
if Hv3 > 0 and v == Hv3 and
((Hh1 > 0 and h == Hh1) or
(Hh2 > 0 and h == Hh2) or
(Hh3 > 0 and h == Hh3)) Then{
Condition3 = true;
var13 = H;
}
//if Condition3 == true and var13 != Hv3 Then
// Condition3 = false;
#########################################################
if Hv3 > 0 and v == Hv3 and
((LL1 > 0 and L == LL1) or
(LL2 > 0 and L == LL2) or
(LL3 > 0 and L == LL3)) Then{
Condition33 = true;
var33 = L;
}
//if Condition33 == true and var33 != hv3 Then
// Condition33 = false;
############################################
if Condition3 == true then{
plot3(var13,"H3",blue,def,0);
}
if Condition33 == true then{
plot33(var33,"L3",blue,def,0);
}
즐거운 하루되세요
> yes 님이 쓴 글입니다.
> 제목 : 부탁 드립니다.
> 도움 주심에 경배로 감사 인사 드립니다.
질문1)
일시를 지정한 A,B,C, 세점을
연결한 선 등 첨부한 그림과 같이 부탁 드립니다.
질문2)
해선에서
p100으로 지정된 기간에 생성된 선이 길게 나타 날 경우
(당일을 초과하여 다음날로 연장될 경우)
06:00에는 정지하여
그선이 다음날(07:00 이후) 에는 나타나지 않게 가능 하겠는지요?
(var13 != Hv3, var33 != hv3->를 사용하지 않는 수식으로)
input : p100(30);
var : HV1(0),HV2(0),HV3(0);
var : HH1(0),HH2(0),HH3(0);
var : LL1(0),LL2(0),LL3(0);
HV1=NthHighest(1,v,p100);
HV2=nthhighest(2,v,p100);
HV3=nthhighest(3,v,p100);
HH1=NthHighest(1,h,p100);
HH2=nthhighest(2,h,p100);
HH3=nthhighest(3,h,p100);
LL1=NthLowest(1,L,P100);
LL2=NTHLOWEST(2,L,P100);
LL3=NTHLOWEST(3,L,P100);
if Hv3 > 0 and v == Hv3 and
((Hh1 > 0 and h == Hh1) or
(Hh2 > 0 and h == Hh2) or
(Hh3 > 0 and h == Hh3)) Then{
Condition3 = true;
var13 = H;
}
//if Condition3 == true and var13 != Hv3 Then
// Condition3 = false;
#########################################################
if Hv3 > 0 and v == Hv3 and
((LL1 > 0 and L == LL1) or
(LL2 > 0 and L == LL2) or
(LL3 > 0 and L == LL3)) Then{
Condition33 = true;
var33 = L;
}
//if Condition33 == true and var33 != hv3 Then
// Condition33 = false;
############################################
if Condition3 == true then{
plot3(var13,"H3",blue,def,0);
}
if Condition33 == true then{
plot33(var33,"L3",blue,def,0);
}