커뮤니티
수식부탁드립니다

2020-04-17 09:54:13
947
글번호 137990
첨부 이미지
그림1

1.input :카운팅시작일자(20200407), 카운팅시작시간(070000);
var : Tcond(false);
if sdate >= 카운팅시작일자 and stime >= 카운팅시작시간 Then
Tcond = true;
if Tcond == true Then
{
if (sdate != sdate[1] and stime >= 카운팅시작시간) or
(sdate == sdate[1] and stime >= 카운팅시작시간 and stime[1] < 카운팅시작시간) Then
{
var1 = 0;
var2 = 0;
}
If var1+V >var2+ V[1] Then
{
Plot1(V, "상승거래량",red);
Plot2(0, "하락거래량",blue);
}
Else
{
Plot1(0, "상승거래량",red);
Plot2(V, "하락거래량",blue);
}}
2.
input :카운팅시작일자(20200407), 카운팅시작시간(070000);
var : Tcond(false);
var : tx(0);
if sdate >= 카운팅시작일자 and stime >= 카운팅시작시간 Then
Tcond = true;
if Tcond == true Then
{
if (sdate != sdate[1] and stime >= 카운팅시작시간) or
(sdate == sdate[1] and stime >= 카운팅시작시간 and stime[1] < 카운팅시작시간) Then
{
var1 = 0;
var2 = 0;
}
if dayindex >= 0 Then{
if C > O or (C == O and C >= C[1]) Then
var1 = var1+V;
Else
var2 = var2+V;
value2 =var1-var2 ;
plot1(value2,"1",iff(value2>0,RED,BLUE));
PlotBaseLine1(0, "중심",black);
}}
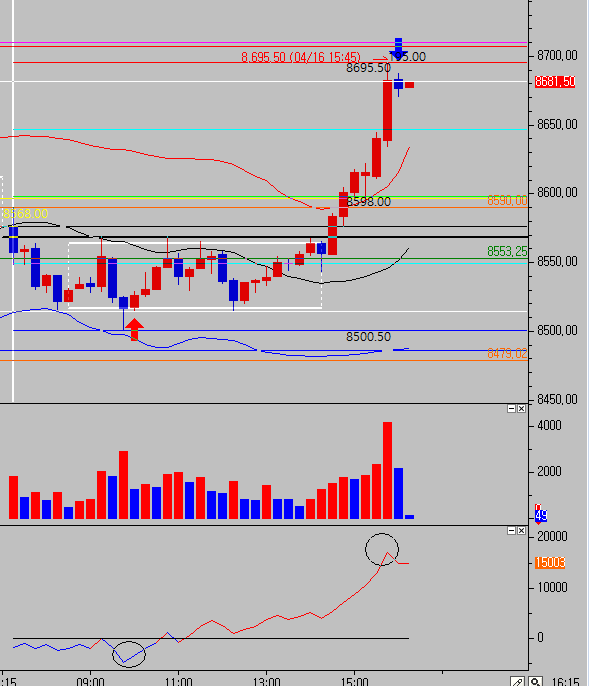
1. 전봉대비 거래량
2. 양봉-음봉=거래량
상기그림에서
1.전봉대비거래량에서 양이형성되고
2.양봉-음봉=거래량 에서 변곡이 발생되었을때 다음봉에서 신호가 나옴.
다음반대신호가 나올때까지 같은방향신호는 무시함.
시스템 수식부탁드립니다
- 1. 138630_캡처.PNG (0.02 MB)
답변 2

예스스탁 예스스탁 답변
2020-04-17 11:32:00
안녕하세요
예스스탁입니다.
input :카운팅시작일자(20200407), 카운팅시작시간(070000);
var : Tcond(false),T(0);
if sdate >= 카운팅시작일자 and stime >= 카운팅시작시간 Then
Tcond = true;
if Tcond == true Then
{
if (sdate != sdate[1] and stime >= 카운팅시작시간) or
(sdate == sdate[1] and stime >= 카운팅시작시간 and stime[1] < 카운팅시작시간) Then
{
var1 = 0;
var2 = 0;
var3 = 0;
var4 = 0;
}
Condition1 = var1+V > var2+V[1];
if dayindex >= 0 Then{
if C > O or (C == O and C >= C[1]) Then
var3 = var3+V;
Else
var4 = var4+V;
value2 =var3-var4 ;
if value2 > value2[1] Then
T = 1;
if value2 < value2[1] Then
T = -1;
if T == 1 and T != T[1] and value2 < 0 and Condition1[1] == true Then
buy();
if T == -1 and T != T[1] and value2 > 0 and Condition1[1] == true Then
sell();
}}
즐거운 하루되세요
> 수색대대 님이 쓴 글입니다.
> 제목 : 수식부탁드립니다
> 1.input :카운팅시작일자(20200407), 카운팅시작시간(070000);
var : Tcond(false);
if sdate >= 카운팅시작일자 and stime >= 카운팅시작시간 Then
Tcond = true;
if Tcond == true Then
{
if (sdate != sdate[1] and stime >= 카운팅시작시간) or
(sdate == sdate[1] and stime >= 카운팅시작시간 and stime[1] < 카운팅시작시간) Then
{
var1 = 0;
var2 = 0;
}
If var1+V >var2+ V[1] Then
{
Plot1(V, "상승거래량",red);
Plot2(0, "하락거래량",blue);
}
Else
{
Plot1(0, "상승거래량",red);
Plot2(V, "하락거래량",blue);
}}
2.
input :카운팅시작일자(20200407), 카운팅시작시간(070000);
var : Tcond(false);
var : tx(0);
if sdate >= 카운팅시작일자 and stime >= 카운팅시작시간 Then
Tcond = true;
if Tcond == true Then
{
if (sdate != sdate[1] and stime >= 카운팅시작시간) or
(sdate == sdate[1] and stime >= 카운팅시작시간 and stime[1] < 카운팅시작시간) Then
{
var1 = 0;
var2 = 0;
}
if dayindex >= 0 Then{
if C > O or (C == O and C >= C[1]) Then
var1 = var1+V;
Else
var2 = var2+V;
value2 =var1-var2 ;
plot1(value2,"1",iff(value2>0,RED,BLUE));
PlotBaseLine1(0, "중심",black);
}}
1. 전봉대비 거래량
2. 양봉-음봉=거래량
상기그림에서
1.전봉대비거래량에서 양이형성되고
2.양봉-음봉=거래량 에서 변곡이 발생되었을때 다음봉에서 신호가 나옴.
다음반대신호가 나올때까지 같은방향신호는 무시함.
시스템 수식부탁드립니다
수색대대
2020-04-17 13:51:30
수색대대 님에 의해 삭제된 답변입니다.
다음글
이전글