커뮤니티
문의드립니다.

2020-10-11 01:12:57
845
글번호 142970
첨부 이미지
그림1

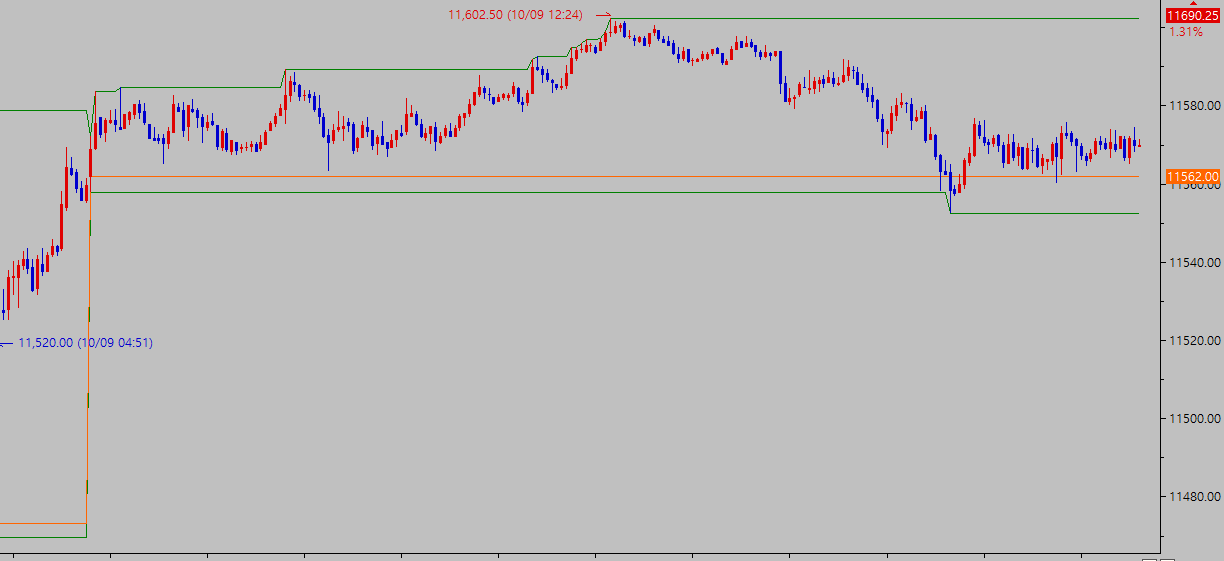
그림은 당일 시,고 ,저점을 표시한 선입니다.
그런데 전일 시, 고, 저점의 선때문에 당일 차트가 위쪽으로 몰리는
현상이 나타나는데요...
당일 시, 고 , 저점을 나타내는 지표만 부탁합니다.
*** 당일 시, 고 , 저점이 표시되면
전일 시, 고 ,저점은 표시되지 않도록 부탁합니다.
======================================================================
아래수식을 예스로 부탁합니다.
src = input(title="Source", defval=close)
alpha = input(title="Alpha", type=float, minval=0, maxval=1, step=0.1, defval=0.2)
colorchange = input(title="Change Color ?", type=bool, defval=false)
gamma=1-alpha
L0 = 0.0
L0 := (1-gamma) * src + gamma * nz(L0[1])
L1 = 0.0
L1 := -gamma * L0 + nz(L0[1]) + gamma * nz(L1[1])
L2 = 0.0
L2 := -gamma * L1 + nz(L1[1]) + gamma * nz(L2[1])
L3 = 0.0
L3 := -gamma * L2 + nz(L2[1]) + gamma * nz(L3[1])
cu= (L0>L1 ? L0-L1 : 0) + (L1>L2 ? L1-L2 : 0) + (L2>L3 ? L2-L3 : 0)
cd= (L0<L1 ? L1-L0 : 0) + (L1<L2 ? L2-L1 : 0) + (L2<L3 ? L3-L2 : 0)
temp= cu+cd==0 ? -1 : cu+cd
LaRSI=temp==-1 ? 0 : cu/temp
Color = colorchange ? (LaRSI > LaRSI[1] ? green : red) : blue
plot(100*LaRSI, title="LaRSI", linewidth=2, color=Color, transp=0)
plot(20,linewidth=1, color=maroon, transp=0)
plot(80,linewidth=1, color=maroon, transp=0)
=======================================================================
T3FiboLine = input(false, title="Show T3 Fibonacci Ratio Line?")
length1 = input(8, "T3 Length")
a1 = input(0.7, "Volume Factor")
e1 = ema((high + low + 2 * close) / 4, length1)
e2 = ema(e1, length1)
e3 = ema(e2, length1)
e4 = ema(e3, length1)
e5 = ema(e4, length1)
e6 = ema(e5, length1)
c1 = -a1 * a1 * a1
c2 = 3 * a1 * a1 + 3 * a1 * a1 * a1
c3 = -6 * a1 * a1 - 3 * a1 - 3 * a1 * a1 * a1
c4 = 1 + 3 * a1 + a1 * a1 * a1 + 3 * a1 * a1
T3 = c1 * e6 + c2 * e5 + c3 * e4 + c4 * e3
col1 = T3 > T3[1]
col3 = T3 < T3[1]
color_1 = col1 ? color.green : col3 ? color.red : color.yellow
plot(T3, color=color_1, linewidth=3, title="T3")
length12 = input(5, "T3 Length fibo")
a12 = input(0.618, "Volume Factor fibo")
e12 = ema((high + low + 2 * close) / 4, length12)
e22 = ema(e12, length12)
e32 = ema(e22, length12)
e42 = ema(e32, length12)
e52 = ema(e42, length12)
e62 = ema(e52, length12)
c12 = -a12 * a12 * a12
c22 = 3 * a12 * a12 + 3 * a12 * a12 * a12
c32 = -6 * a12 * a12 - 3 * a12 - 3 * a12 * a12 * a12
c42 = 1 + 3 * a12 + a12 * a12 * a12 + 3 * a12 * a12
T32 = c12 * e62 + c22 * e52 + c32 * e42 + c42 * e32
col12 = T32 > T32[1]
col32 = T32 < T32[1]
color2 = col12 ? color.blue : col32 ? color.purple : color.yellow
plot(T3FiboLine and T32 ? T32 : na, color=color2, linewidth=2, title="T3fibo")
alertcondition(crossover(T3, T3[1]), title="T3 BUY", message="T3 BUY!")
alertcondition(crossunder(T3, T3[1]), title="T3 SELL", message="T3 SELL!")
alertcondition(cross(T3, T3[1]), title="Color ALARM", message="T3 has changed color!")
- 1. ggg.PNG (0.02 MB)
답변 1

예스스탁 예스스탁 답변
2020-10-12 16:12:47
안녕하세요
예스스탁입니다.
1
if CurrentTime < 80000 Then
var1 = DateToJulian(CurrentDate)-1;
else
var1 = DateToJulian(CurrentDate);
if DateToJulian(bdate) >= var1 Then
{
Plot1(DayOpen);
Plot2(DayHigh);
Plot3(DayLow);
}
2
input : alpha(0.2),colorchange(False);
var : src(0),gamma(0),L0(0),L1(0),L2(0),L3(0),cu(0),cd(0);
var : temp(0),LaRSI(0),Color(0);
src = c;
L0 = (1-gamma) * src + gamma * IFf(IsNan(L0[1]) == true,0,L0);
L1 = -gamma * L0 + IFf(IsNan(L0[1]) == true,0,L0[1]) + gamma * IFf(IsNaN(L1[1]) == true,0,L1[1]);
L2 = -gamma * L1 + IFf(IsNan(L1[1]) == true,0,L1[1]) + gamma * IFf(IsNaN(L2[1]) == true,0,L1[1]);
L3 = -gamma * L2 + IFf(IsNan(L2[1]) == true,0,L2[1]) + gamma * IFf(IsNaN(L3[1]) == true,0,L1[1]);
cu = IFf(L0>L1, L0-L1, 0) + IFf(L1>L2, L1-L2, 0) + IFf(L2>L3, L2-L3, 0);
cd = iff(L0<L1, L1-L0, 0) + IFf(L1<L2, L2-L1, 0) + IFf(L2<L3, L3-L2, 0);
temp = iff(cu+cd==0 , -1 , cu+cd);
LaRSI = iff(temp==-1 , 0 , cu/temp);
Color = iff(colorchange , IFf(LaRSI > LaRSI[1] , green , red) , blue);
plot1(100*LaRSI,"LaRSI");
plot2(20);
plot3(80);
2
input : T3FiboLine(false),length1(8),a1(0.7);
var : e1(0),e2(0),e3(0),e4(0),e5(0),e6(0);
var : c1(0),c2(0),c3(0),c4(0),t3(0),col1(False),col3(False),color_1(0);
var : e12(0),e22(0),e32(0),e42(0),e52(0),e62(0);
var : c12(0),c22(0),c32(0),c42(0),t32(0),col12(False),col32(False),color2(0);
e1 = ema((high + low + 2 * close) / 4, length1);
e2 = ema(e1, length1);
e3 = ema(e2, length1);
e4 = ema(e3, length1);
e5 = ema(e4, length1);
e6 = ema(e5, length1);
c1 = -a1 * a1 * a1;
c2 = 3 * a1 * a1 + 3 * a1 * a1 * a1;
c3 = -6 * a1 * a1 - 3 * a1 - 3 * a1 * a1 * a1;
c4 = 1 + 3 * a1 + a1 * a1 * a1 + 3 * a1 * a1;
T3 = c1 * e6 + c2 * e5 + c3 * e4 + c4 * e3;
col1 = T3 > T3[1];
col3 = T3 < T3[1];
color_1 = iff(col1 ,green,IFf(col3,red,yellow));
plot1(T3,"T3",color_1);
input : length12(5),a12(0.618);
e12 = ema((high + low + 2 * close) / 4, length12);
e22 = ema(e12, length12);
e32 = ema(e22, length12);
e42 = ema(e32, length12);
e52 = ema(e42, length12);
e62 = ema(e52, length12);
c12 = -a12 * a12 * a12;
c22 = 3 * a12 * a12 + 3 * a12 * a12 * a12;
c32 = -6 * a12 * a12 - 3 * a12 - 3 * a12 * a12 * a12;
c42 = 1 + 3 * a12 + a12 * a12 * a12 + 3 * a12 * a12;
T32 = c12 * e62 + c22 * e52 + c32 * e42 + c42 * e32;
col12 = T32 > T32[1];
col32 = T32 < T32[1];
color2 = iff(col12 ,blue,IFf(col32 , BLUE,yellow));
plot2(T32,"T3fibo",color2);
즐거운 하루되세요
> as8282 님이 쓴 글입니다.
> 제목 : 문의드립니다.
> 그림은 당일 시,고 ,저점을 표시한 선입니다.
그런데 전일 시, 고, 저점의 선때문에 당일 차트가 위쪽으로 몰리는
현상이 나타나는데요...
당일 시, 고 , 저점을 나타내는 지표만 부탁합니다.
*** 당일 시, 고 , 저점이 표시되면
전일 시, 고 ,저점은 표시되지 않도록 부탁합니다.
======================================================================
아래수식을 예스로 부탁합니다.
src = input(title="Source", defval=close)
alpha = input(title="Alpha", type=float, minval=0, maxval=1, step=0.1, defval=0.2)
colorchange = input(title="Change Color ?", type=bool, defval=false)
gamma=1-alpha
L0 = 0.0
L0 := (1-gamma) * src + gamma * nz(L0[1])
L1 = 0.0
L1 := -gamma * L0 + nz(L0[1]) + gamma * nz(L1[1])
L2 = 0.0
L2 := -gamma * L1 + nz(L1[1]) + gamma * nz(L2[1])
L3 = 0.0
L3 := -gamma * L2 + nz(L2[1]) + gamma * nz(L3[1])
cu= (L0>L1 ? L0-L1 : 0) + (L1>L2 ? L1-L2 : 0) + (L2>L3 ? L2-L3 : 0)
cd= (L0<L1 ? L1-L0 : 0) + (L1<L2 ? L2-L1 : 0) + (L2<L3 ? L3-L2 : 0)
temp= cu+cd==0 ? -1 : cu+cd
LaRSI=temp==-1 ? 0 : cu/temp
Color = colorchange ? (LaRSI > LaRSI[1] ? green : red) : blue
plot(100*LaRSI, title="LaRSI", linewidth=2, color=Color, transp=0)
plot(20,linewidth=1, color=maroon, transp=0)
plot(80,linewidth=1, color=maroon, transp=0)
=======================================================================
T3FiboLine = input(false, title="Show T3 Fibonacci Ratio Line?")
length1 = input(8, "T3 Length")
a1 = input(0.7, "Volume Factor")
e1 = ema((high + low + 2 * close) / 4, length1)
e2 = ema(e1, length1)
e3 = ema(e2, length1)
e4 = ema(e3, length1)
e5 = ema(e4, length1)
e6 = ema(e5, length1)
c1 = -a1 * a1 * a1
c2 = 3 * a1 * a1 + 3 * a1 * a1 * a1
c3 = -6 * a1 * a1 - 3 * a1 - 3 * a1 * a1 * a1
c4 = 1 + 3 * a1 + a1 * a1 * a1 + 3 * a1 * a1
T3 = c1 * e6 + c2 * e5 + c3 * e4 + c4 * e3
col1 = T3 > T3[1]
col3 = T3 < T3[1]
color_1 = col1 ? color.green : col3 ? color.red : color.yellow
plot(T3, color=color_1, linewidth=3, title="T3")
length12 = input(5, "T3 Length fibo")
a12 = input(0.618, "Volume Factor fibo")
e12 = ema((high + low + 2 * close) / 4, length12)
e22 = ema(e12, length12)
e32 = ema(e22, length12)
e42 = ema(e32, length12)
e52 = ema(e42, length12)
e62 = ema(e52, length12)
c12 = -a12 * a12 * a12
c22 = 3 * a12 * a12 + 3 * a12 * a12 * a12
c32 = -6 * a12 * a12 - 3 * a12 - 3 * a12 * a12 * a12
c42 = 1 + 3 * a12 + a12 * a12 * a12 + 3 * a12 * a12
T32 = c12 * e62 + c22 * e52 + c32 * e42 + c42 * e32
col12 = T32 > T32[1]
col32 = T32 < T32[1]
color2 = col12 ? color.blue : col32 ? color.purple : color.yellow
plot(T3FiboLine and T32 ? T32 : na, color=color2, linewidth=2, title="T3fibo")
alertcondition(crossover(T3, T3[1]), title="T3 BUY", message="T3 BUY!")
alertcondition(crossunder(T3, T3[1]), title="T3 SELL", message="T3 SELL!")
alertcondition(cross(T3, T3[1]), title="Color ALARM", message="T3 has changed color!")