커뮤니티
71288 요청에 대한 답변 수식에서

2021-06-23 13:31:33
1358
글번호 150205
첨부 이미지
그림1

그림2

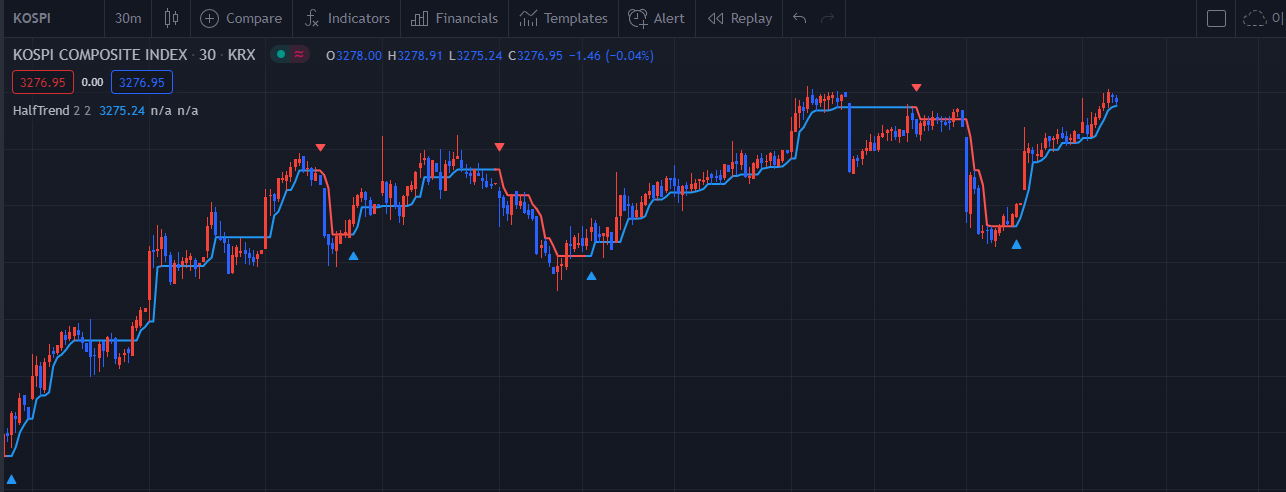
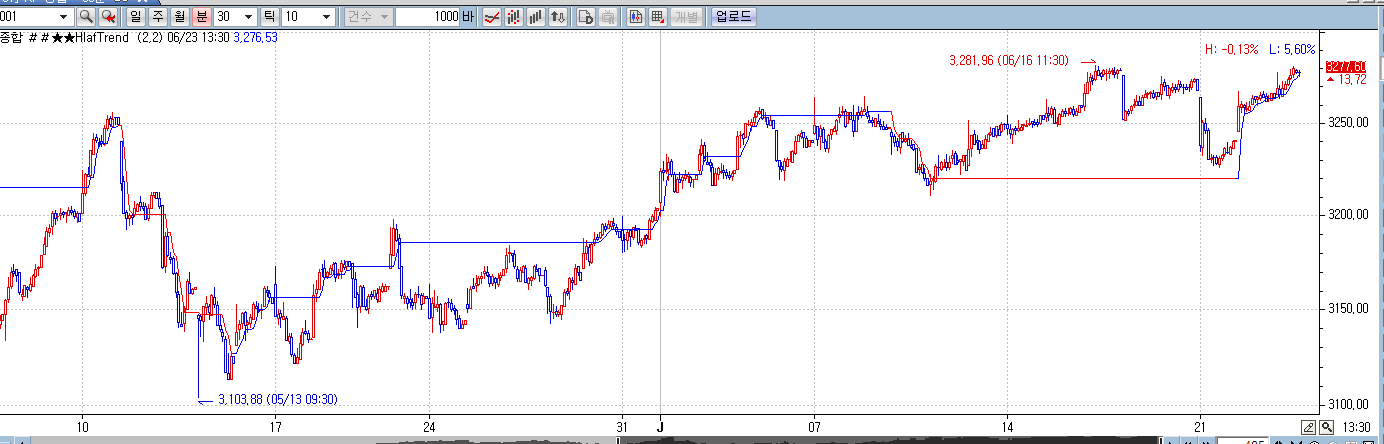
챠트에서 구현된 지표가 오류가 나는데
(검정바탕그림이 halftrend 지표)
(하얀바탕이 예스 작성해주신 수식 적용결과)
검토 부탁드립니다.
- 1. halftrend.png (0.06 MB)
- 2. halftrend2.png (0.04 MB)
답변 1

예스스탁 예스스탁 답변
2021-06-24 10:46:51
안녕하세요
예스스탁입니다.
수정한 식입니다.
input : amplitude(2),channelDeviation(2);
var : trend(0),nextTrend(0),maxLowPrice(0),minHighPrice(0);
var : up(0),down(0),atrHigh(0),atrLow(0),arrowUp(0),arrowDown(0);
var : atr2(0),dev(0),highPrice(0),lowPrice(0),highma(0),lowma(0),ht(0);
atr2 = atr(100) / 2;
dev = channelDeviation * atr2;
highPrice = Highest(H,amplitude);
lowPrice = Lowest(L,amplitude);
highma = ma(high, amplitude);
lowma = ma(low, amplitude);
if nextTrend == 1 Then
{
maxLowPrice = max(lowPrice, maxLowPrice);
if highma < maxLowPrice and close < iff(isnan(low[1])==true,low,Low[1]) Then
{
trend = 1;
nextTrend = 0;
minHighPrice = highPrice;
}
}
else
{
minHighPrice = min(highPrice, minHighPrice);
if lowma > minHighPrice and close > iff(isnan(high[1])==true,high,high[1]) Then
{
trend = 0;
nextTrend = 1;
maxLowPrice = lowPrice;
}
}
if trend == 0 Then
{
if IsNaN(trend[1]) == False and trend[1] != 0 Then
{
up = iff(IsNaN(down[1]) == true,down,down[1]);
arrowUp = up - atr2;
}
else
{
up = iff(IsNan(up[1]) == true, maxLowPrice , max(maxLowPrice, up[1]));
}
atrHigh = up + dev;
atrLow = up - dev;
}
else
{
if isnan(trend[1]) == False and trend[1] != 1 Then
{
down = iff(IsNan(up[1]) == true, up , up[1]);
arrowDown = down + atr2;
}
else
{
down = iff(IsNan(down[1]) == true, minHighPrice ,min(minHighPrice, down[1]));
}
atrHigh = down + dev;
atrLow = down - dev;
}
ht = iff(trend == 0 , up , down);
plot1(ht, "HalfTrend",iff(trend == 0 ,BLUE,RED));
plot2(atrHigh,"ATR High",RED);
plot3(atrLow, "ATR Low", BLUE);
즐거운 하루되세요
> 당일선물 님이 쓴 글입니다.
> 제목 : 71288 요청에 대한 답변 수식에서
> 챠트에서 구현된 지표가 오류가 나는데
(검정바탕그림이 halftrend 지표)
(하얀바탕이 예스 작성해주신 수식 적용결과)
검토 부탁드립니다.
이전글