커뮤니티
지표수식 변환 요청드립니다

2022-11-23 13:21:32
1365
글번호 164036
첨부 이미지
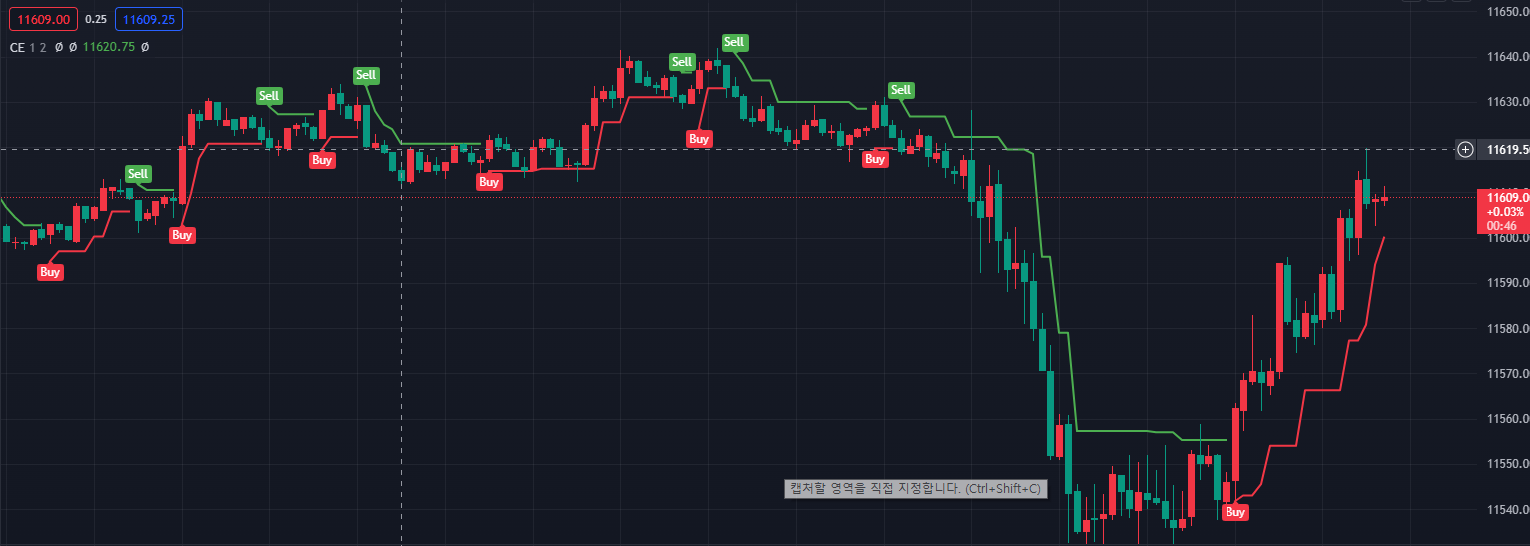
그림1

트레이딩뷰 Chandelier Exit 지표를 예스수식으로 변환부탁드립니다.
신호발생(buy,sell )은 검색식(혹은 지표식)으로 하면서 그림과 같이 선만 나오면 될 듯합니다.
종가를 사용하는 경우와 그렇지 않은 경우를 선택할 수 있으면 좋겠습니다.
===========
//@version=4
// Copyright (c) 2019-present, Alex Orekhov (everget)
license.
study("Chandelier Exit", shorttitle="CE", overlay=true)
length = input(title="ATR Period", type=input.integer, defval=22)
mult = input(title="ATR Multiplier", type=input.float, step=0.1, defval=3.0)
showLabels = input(title="Show Buy/Sell Labels ?", type=input.bool, defval=true)
useClose = input(title="Use Close Price for Extremums ?", type=input.bool, defval=true)
highlightState = input(title="Highlight State ?", type=input.bool, defval=true)
atr = mult * atr(length)
longStop = (useClose ? highest(close, length) : highest(length)) - atr
longStopPrev = nz(longStop[1], longStop)
longStop := close[1] > longStopPrev ? max(longStop, longStopPrev) : longStop
shortStop = (useClose ? lowest(close, length) : lowest(length)) + atr
shortStopPrev = nz(shortStop[1], shortStop)
shortStop := close[1] < shortStopPrev ? min(shortStop, shortStopPrev) : shortStop
var int dir = 1
dir := close > shortStopPrev ? 1 : close < longStopPrev ? -1 : dir
var color longColor = color.green
var color shortColor = color.red
longStopPlot = plot(dir == 1 ? longStop : na, title="Long Stop", style=plot.style_linebr, linewidth=2, color=longColor)
buySignal = dir == 1 and dir[1] == -1
plotshape(buySignal ? longStop : na, title="Long Stop Start", location=location.absolute, style=shape.circle, size=size.tiny, color=longColor, transp=0)
plotshape(buySignal and showLabels ? longStop : na, title="Buy Label", text="Buy", location=location.absolute, style=shape.labelup, size=size.tiny, color=longColor, textcolor=color.white, transp=0)
shortStopPlot = plot(dir == 1 ? na : shortStop, title="Short Stop", style=plot.style_linebr, linewidth=2, color=shortColor)
sellSignal = dir == -1 and dir[1] == 1
plotshape(sellSignal ? shortStop : na, title="Short Stop Start", location=location.absolute, style=shape.circle, size=size.tiny, color=shortColor, transp=0)
plotshape(sellSignal and showLabels ? shortStop : na, title="Sell Label", text="Sell", location=location.absolute, style=shape.labeldown, size=size.tiny, color=shortColor, textcolor=color.white, transp=0)
midPricePlot = plot(ohlc4, title="", style=plot.style_circles, linewidth=0, display=display.none, editable=false)
longFillColor = highlightState ? (dir == 1 ? longColor : na) : na
shortFillColor = highlightState ? (dir == -1 ? shortColor : na) : na
fill(midPricePlot, longStopPlot, title="Long State Filling", color=longFillColor)
fill(midPricePlot, shortStopPlot, title="Short State Filling", color=shortFillColor)
changeCond = dir != dir[1]
alertcondition(changeCond, title="Alert: CE Direction Change", message="Chandelier Exit has changed direction!")
alertcondition(buySignal, title="Alert: CE Buy", message="Chandelier Exit Buy!")
alertcondition(sellSignal, title="Alert: CE Sell", message="Chandelier Exit Sell!")
- 1. 20221123_002732.png (0.07 MB)
답변 1

예스스탁 예스스탁 답변
2022-11-23 15:43:30
안녕하세요
예스스탁입니다.
input : length(22),mult(3.0),showLabels(true),useClose(true),highlightState(true);
var : ATrv(0),longStop(0),longStopprev(0),shortStop(0),shortStopPrev(0);
var : dir(1),longcolor(Green),shortcolor(Red),tx(0);
atrv = mult * atr(length);
longStop = IFf(useClose , highest(close, length) , highest(h,length)) - atrv;
longStopPrev = longStop[1];
longStop = iff(close[1] > longStopPrev , max(longStop, longStopPrev) , longStop);
shortStop = IFf(useClose , lowest(close, length) , lowest(L,length)) + atrv;
shortStopPrev = shortStop[1];
shortStop = iff(close[1] < shortStopPrev , min(shortStop, shortStopPrev) , shortStop);
dir = iff(close > shortStopPrev , 1 ,iff( close < longStopPrev , -1 , dir));
IF dir == 1 Then
{
plot1(longStop,"Long Stop",longColor);
NoPlot(2);
}
Else
{
NoPlot(1);
plot2(shortStop,"Short Stop",shortColor);
}
if dir == 1 and dir[1] == -1 Then
{
tx = Text_New(sDate,sTime,longStop,"▲");
Text_SetStyle(tx,2,0);
Text_SetColor(tx,longcolor);
}
if dir == -1 and dir[1] == 1 Then
{
tx = Text_New(sDate,sTime,shortStop,"▼");
Text_SetStyle(tx,2,1);
Text_SetColor(tx,shortcolor);
}
즐거운 하루되세요
> 당일선물 님이 쓴 글입니다.
> 제목 : 지표수식 변환 요청드립니다
> 트레이딩뷰 Chandelier Exit 지표를 예스수식으로 변환부탁드립니다.
신호발생(buy,sell )은 검색식(혹은 지표식)으로 하면서 그림과 같이 선만 나오면 될 듯합니다.
종가를 사용하는 경우와 그렇지 않은 경우를 선택할 수 있으면 좋겠습니다.
===========
//@version=4
// Copyright (c) 2019-present, Alex Orekhov (everget)
license.
study("Chandelier Exit", shorttitle="CE", overlay=true)
length = input(title="ATR Period", type=input.integer, defval=22)
mult = input(title="ATR Multiplier", type=input.float, step=0.1, defval=3.0)
showLabels = input(title="Show Buy/Sell Labels ?", type=input.bool, defval=true)
useClose = input(title="Use Close Price for Extremums ?", type=input.bool, defval=true)
highlightState = input(title="Highlight State ?", type=input.bool, defval=true)
atr = mult * atr(length)
longStop = (useClose ? highest(close, length) : highest(length)) - atr
longStopPrev = nz(longStop[1], longStop)
longStop := close[1] > longStopPrev ? max(longStop, longStopPrev) : longStop
shortStop = (useClose ? lowest(close, length) : lowest(length)) + atr
shortStopPrev = nz(shortStop[1], shortStop)
shortStop := close[1] < shortStopPrev ? min(shortStop, shortStopPrev) : shortStop
var int dir = 1
dir := close > shortStopPrev ? 1 : close < longStopPrev ? -1 : dir
var color longColor = color.green
var color shortColor = color.red
longStopPlot = plot(dir == 1 ? longStop : na, title="Long Stop", style=plot.style_linebr, linewidth=2, color=longColor)
buySignal = dir == 1 and dir[1] == -1
plotshape(buySignal ? longStop : na, title="Long Stop Start", location=location.absolute, style=shape.circle, size=size.tiny, color=longColor, transp=0)
plotshape(buySignal and showLabels ? longStop : na, title="Buy Label", text="Buy", location=location.absolute, style=shape.labelup, size=size.tiny, color=longColor, textcolor=color.white, transp=0)
shortStopPlot = plot(dir == 1 ? na : shortStop, title="Short Stop", style=plot.style_linebr, linewidth=2, color=shortColor)
sellSignal = dir == -1 and dir[1] == 1
plotshape(sellSignal ? shortStop : na, title="Short Stop Start", location=location.absolute, style=shape.circle, size=size.tiny, color=shortColor, transp=0)
plotshape(sellSignal and showLabels ? shortStop : na, title="Sell Label", text="Sell", location=location.absolute, style=shape.labeldown, size=size.tiny, color=shortColor, textcolor=color.white, transp=0)
midPricePlot = plot(ohlc4, title="", style=plot.style_circles, linewidth=0, display=display.none, editable=false)
longFillColor = highlightState ? (dir == 1 ? longColor : na) : na
shortFillColor = highlightState ? (dir == -1 ? shortColor : na) : na
fill(midPricePlot, longStopPlot, title="Long State Filling", color=longFillColor)
fill(midPricePlot, shortStopPlot, title="Short State Filling", color=shortFillColor)
changeCond = dir != dir[1]
alertcondition(changeCond, title="Alert: CE Direction Change", message="Chandelier Exit has changed direction!")
alertcondition(buySignal, title="Alert: CE Buy", message="Chandelier Exit Buy!")
alertcondition(sellSignal, title="Alert: CE Sell", message="Chandelier Exit Sell!")
다음글
이전글