커뮤니티
지표수식 변환 요청드립니다

2022-12-18 14:55:29
1997
글번호 164663
첨부 이미지
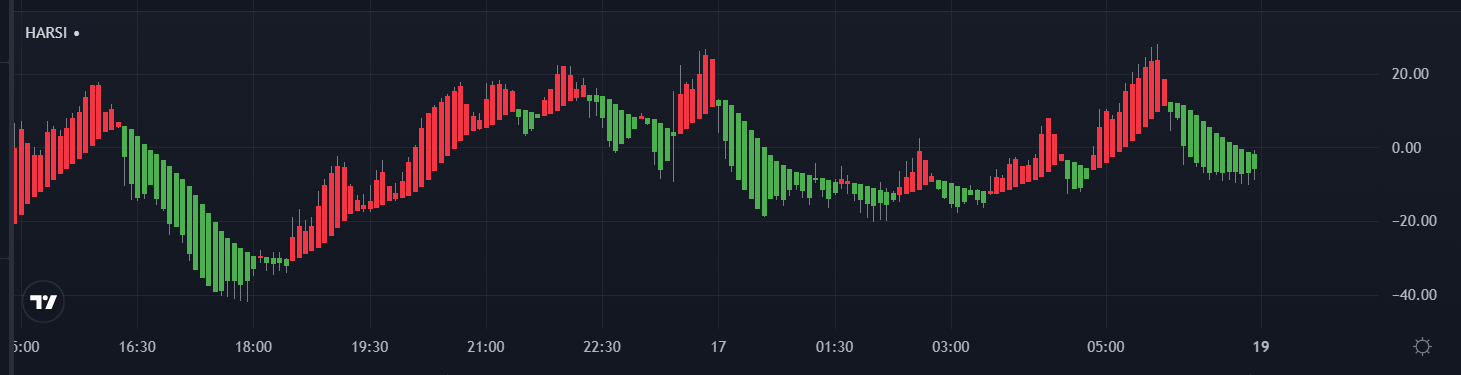
그림1

수식변환 요청드립니다.
아래수식은 트레이딩뷰 지표식인데 이미지파일 그림처럼 캔들로 구현하지 못하더라도
HARSI 바디 시가 종가 고가 저가 를 선으로 출력되어도 됩니다
##=======// //@version=5
//@author=JayRogers
indicator('Heikin Ashi RSI Oscillator', 'HARSI •', false, format.price, 2)
string TT_HARSI = 'Period for the RSI calculations used to generate the' + 'candles. This seperate from the RSI plot/histogram length.'
string TT_PBIAS = 'Smoothing feature for the OPEN of the HARSI candles.' + '
Increases bias toward the prior open value which can' + ' help provide better visualisation of trend strength.' + '
** By changing the Open values, High and Low can also' + ' be distorted - however Close will remain unchanged.'
string TT_SMRSI = 'This option smoothes the RSI in a manner similar to HA' + ' open, but uses the realtime rsi rather than the prior' + ' close value.'
///////////////////////////////////////////////////////////////////////
// //
// ====== INPUTS ====== //
// //
////////////////////////////////////////////////////////////////////////////////
// -- Candle config
string GROUP_CAND = 'Config » HARSI Candles'
i_lenHARSI = input.int(14, 'Length', group=GROUP_CAND, minval=1, tooltip=TT_HARSI)
i_smoothing = input.int(7, 'Open Smoothing', group=GROUP_CAND, minval=1, maxval=100, tooltip=TT_PBIAS)
string INLINE_COL = 'Colour Pallette'
i_colUp = input.color(color.red, 'Colour Pallette  ', group=GROUP_CAND, inline=INLINE_COL)
i_colDown = input.color(color.teal, ' ', group=GROUP_CAND, inline=INLINE_COL)
i_colWick = input.color(color.gray, ' ', group=GROUP_CAND, inline=INLINE_COL)
// -- RSI plot config
string GROUP_PLOT = 'Config » RSI Plot'
i_source = input.source(ohlc4, 'Source', group=GROUP_PLOT)
i_lenRSI = input.int(7, 'Length', group=GROUP_PLOT, minval=1)
i_mode = input.bool(true, 'Smoothed Mode RSI?', group=GROUP_PLOT, tooltip=TT_SMRSI)
////////////////////////////////////////////////////////////////////////////////
// //
// ====== FUNCTIONS ====== //
// //
////////////////////////////////////////////////////////////////////////////////
// zero median rsi helper function, just subtracts 50.
f_zrsi(_source, _length) =>
ta.rsi(_source, _length) - 50
// mode 셀렉타블 rsi function for standard, or smoothed output
f_rsi(_source, _length, _mode) =>
// get base rsi
float _zrsi = f_zrsi(_source, _length)
// smoothing in a manner similar to HA open, but rather using the realtime
// rsi in place of the prior close value.
var float _smoothed = na
_smoothed := na(_smoothed[1]) ? _zrsi : (_smoothed[1] + _zrsi) / 2
// return the requested mode
_mode ? _smoothed : _zrsi
// RSI Heikin-Ashi generation function
f_rsiHeikinAshi(_length) =>
// get close rsi
float _closeRSI = f_zrsi(close, _length)
// emulate "open" simply by taking the previous close rsi value
float _openRSI = nz(_closeRSI[1], _closeRSI)
// the high and low are tricky, because unlike "high" and "low" by
// themselves, the RSI results can overlap each other. So first we just go
// ahead and get the raw results for high and low, and then..
float _highRSI_raw = f_zrsi(high, _length)
float _lowRSI_raw = f_zrsi(low, _length)
// ..make sure we use the highest for high, and lowest for low
float _highRSI = math.max(_highRSI_raw, _lowRSI_raw)
float _lowRSI = math.min(_highRSI_raw, _lowRSI_raw)
// ha calculation for close
float _close = (_openRSI + _highRSI + _lowRSI + _closeRSI) / 4
// ha calculation for open, standard, and smoothed/lagged
var float _open = na
_open := na(_open[i_smoothing]) ? (_openRSI + _closeRSI) / 2 : (_open[1] * i_smoothing + _close[1]) / (i_smoothing + 1)
// ha high and low min-max 섹렉션
float _high = math.max(_highRSI, math.max(_open, _close))
float _low = math.min(_lowRSI, math.min(_open, _close))
// return the OHLC values
[_open, _high, _low, _close]
////////////////////////////////////////////////////////////////////////////////
// //
// ====== SERIES, LINES and LABELS ====== //
// //
////////////////////////////////////////////////////////////////////////////////
// standard, or ha smoothed rsi for the line plot and/or histogram
float RSI = f_rsi(i_source, i_lenRSI, i_mode)
// get OHLC values to use in the plotcandle()
[O, H, L, C] = f_rsiHeikinAshi(i_lenHARSI)
// candle body colouring
color bodyColour = C > O ? i_colUp : i_colDown
color wickColour = i_colWick
// make our HA rsi candles
plotcandle(O, H, L, C, 'HARSI', bodyColour, wickColour, bordercolor=bodyColour)
- 1. 20221217_135106.png (0.03 MB)
답변 1

예스스탁 예스스탁 답변
2022-12-19 17:20:42
안녕하세요
예스스탁입니다.
2번식은 추세선 함수로 봉처럼 표현한 식입니다.
다만 추세선이 완성봉에만 출력되므로
차트상 마지막봉은 출력되지 않습니다.
1
input : i_lenHARSI(14),i_smoothing(7),i_lenRSI(7);
var : i_colUp(0),i_colDown(0),i_colWick(0),i_source(0);
var : _closeRSI(0),_openRSI(0),_highRSI_raw(0),_lowRSI_raw(0);
var : _highRSI(0),_lowRSI(0),_close(0),_open(0),_high(0),_low(0);
Var : cnt(0), DownAmt1(0), UpAmt1(0), UpSum1(0), DownSum1(0), UpAvg1(0), DownAvg1(0),RSIV1(0);
Var : DownAmt2(0), UpAmt2(0), UpSum2(0), DownSum2(0), UpAvg2(0), DownAvg2(0),RSIV2(0);
var : bodyColour(0),wickColour(0);
i_colUp = red;
i_colDown = teal;
i_colWick = gray;
i_source = (o+h+l+c)/4;
_closeRSI = rsi(i_lenHARSI)-50;
_openRSI = IFF(IsNaN(_closeRSI[1]) == False, _closeRSI[1], _closeRSI);
If CurrentBar == 1 AND i_lenHARSI > 0 Then Begin
UpSum1 = 0;
DownSum1 = 0;
For cnt = 0 To i_lenHARSI - 1 Begin
UpAmt1 = H[cnt] - H[cnt+1];
If UpAmt1 >= 0 Then
DownAmt1 = 0;
Else Begin
DownAmt1 = -UpAmt1;
UpAmt1 = 0;
End;
UpSum1 = UpSum1 + UpAmt1;
DownSum1 = DownSum1 + DownAmt1;
End;
UpAvg1 = UpSum1 / i_lenHARSI;
DownAvg1 = DownSum1 / i_lenHARSI;
End
Else
If CurrentBar > 1 AND i_lenHARSI > 0 Then Begin
UpAmt1 = H[0] - H[1];
If UpAmt1 >= 0 Then
DownAmt1 = 0;
Else Begin
DownAmt1 = -UpAmt1;
UpAmt1 = 0;
End;
UpAvg1 = (UpAvg1[1] * (i_lenHARSI - 1) + UpAmt1) / i_lenHARSI;
DownAvg1 = (DownAvg1[1] * (i_lenHARSI - 1) + DownAmt1) / i_lenHARSI;
End;
If UpAvg1 + DownAvg1 <> 0 Then
RSIV1 = 100 * UpAvg1 / (UpAvg1 + DownAvg1);
Else
RSIV1 = 0;
If CurrentBar == 1 AND i_lenHARSI > 0 Then Begin
UpSum2 = 0;
DownSum2 = 0;
For cnt = 0 To i_lenHARSI - 1 Begin
UpAmt2 = L[cnt] - L[cnt+1];
If UpAmt2 >= 0 Then
DownAmt2 = 0;
Else Begin
DownAmt2 = -UpAmt2;
UpAmt2 = 0;
End;
UpSum2 = UpSum2 + UpAmt2;
DownSum2 = DownSum2 + DownAmt2;
End;
UpAvg2 = UpSum2 / i_lenHARSI;
DownAvg2 = DownSum2 / i_lenHARSI;
End
Else
If CurrentBar > 2 AND i_lenHARSI > 0 Then Begin
UpAmt2 = L[0] - L[1];
If UpAmt2 >= 0 Then
DownAmt2 = 0;
Else Begin
DownAmt2 = -UpAmt2;
UpAmt2 = 0;
End;
UpAvg2 = (UpAvg2[1] * (i_lenHARSI - 1) + UpAmt2) / i_lenHARSI;
DownAvg2 = (DownAvg2[1] * (i_lenHARSI - 1) + DownAmt2) / i_lenHARSI;
End;
If UpAvg2 + DownAvg2 <> 0 Then
RSIV2 = 100 * UpAvg2 / (UpAvg2 + DownAvg2);
Else
RSIV2 = 0;
_highRSI_raw = RSIV1-50;
_lowRSI_raw = RSIV2-50;
_highRSI = max(_highRSI_raw, _lowRSI_raw);
_lowRSI = min(_highRSI_raw, _lowRSI_raw);
_close = (_openRSI + _highRSI + _lowRSI + _closeRSI) / 4;
_open = iff(isnan(_open[i_smoothing]) == true, (_openRSI + _closeRSI) / 2 , (_open[1] * i_smoothing + _close[1]) / (i_smoothing + 1));
_high = max(_highRSI, max(_open, _close));
_low = min(_lowRSI, min(_open, _close));
bodyColour = iff(_close > _open , i_colUp , i_colDown);
wickColour = i_colWick;
Plot1(_open,"O",bodyColour);
Plot2(_close,"C",bodyColour);
Plot3(_high,"H",wickColour);
Plot4(_low,"L",wickColour);
2
input : i_lenHARSI(14),i_smoothing(7),i_lenRSI(7);
var : i_colUp(0),i_colDown(0),i_colWick(0),i_source(0);
var : _closeRSI(0),_openRSI(0),_highRSI_raw(0),_lowRSI_raw(0);
var : _highRSI(0),_lowRSI(0),_close(0),_open(0),_high(0),_low(0);
Var : cnt(0), DownAmt1(0), UpAmt1(0), UpSum1(0), DownSum1(0), UpAvg1(0), DownAvg1(0),RSIV1(0);
Var : DownAmt2(0), UpAmt2(0), UpSum2(0), DownSum2(0), UpAvg2(0), DownAvg2(0),RSIV2(0);
var : bodyColour(0),wickColour(0);
i_colUp = red;
i_colDown = teal;
i_colWick = gray;
i_source = (o+h+l+c)/4;
_closeRSI = rsi(i_lenHARSI)-50;
_openRSI = IFF(IsNaN(_closeRSI[1]) == False, _closeRSI[1], _closeRSI);
If CurrentBar == 1 AND i_lenHARSI > 0 Then Begin
UpSum1 = 0;
DownSum1 = 0;
For cnt = 0 To i_lenHARSI - 1 Begin
UpAmt1 = H[cnt] - H[cnt+1];
If UpAmt1 >= 0 Then
DownAmt1 = 0;
Else Begin
DownAmt1 = -UpAmt1;
UpAmt1 = 0;
End;
UpSum1 = UpSum1 + UpAmt1;
DownSum1 = DownSum1 + DownAmt1;
End;
UpAvg1 = UpSum1 / i_lenHARSI;
DownAvg1 = DownSum1 / i_lenHARSI;
End
Else
If CurrentBar > 1 AND i_lenHARSI > 0 Then Begin
UpAmt1 = H[0] - H[1];
If UpAmt1 >= 0 Then
DownAmt1 = 0;
Else Begin
DownAmt1 = -UpAmt1;
UpAmt1 = 0;
End;
UpAvg1 = (UpAvg1[1] * (i_lenHARSI - 1) + UpAmt1) / i_lenHARSI;
DownAvg1 = (DownAvg1[1] * (i_lenHARSI - 1) + DownAmt1) / i_lenHARSI;
End;
If UpAvg1 + DownAvg1 <> 0 Then
RSIV1 = 100 * UpAvg1 / (UpAvg1 + DownAvg1);
Else
RSIV1 = 0;
If CurrentBar == 1 AND i_lenHARSI > 0 Then Begin
UpSum2 = 0;
DownSum2 = 0;
For cnt = 0 To i_lenHARSI - 1 Begin
UpAmt2 = L[cnt] - L[cnt+1];
If UpAmt2 >= 0 Then
DownAmt2 = 0;
Else Begin
DownAmt2 = -UpAmt2;
UpAmt2 = 0;
End;
UpSum2 = UpSum2 + UpAmt2;
DownSum2 = DownSum2 + DownAmt2;
End;
UpAvg2 = UpSum2 / i_lenHARSI;
DownAvg2 = DownSum2 / i_lenHARSI;
End
Else
If CurrentBar > 2 AND i_lenHARSI > 0 Then Begin
UpAmt2 = L[0] - L[1];
If UpAmt2 >= 0 Then
DownAmt2 = 0;
Else Begin
DownAmt2 = -UpAmt2;
UpAmt2 = 0;
End;
UpAvg2 = (UpAvg2[1] * (i_lenHARSI - 1) + UpAmt2) / i_lenHARSI;
DownAvg2 = (DownAvg2[1] * (i_lenHARSI - 1) + DownAmt2) / i_lenHARSI;
End;
If UpAvg2 + DownAvg2 <> 0 Then
RSIV2 = 100 * UpAvg2 / (UpAvg2 + DownAvg2);
Else
RSIV2 = 0;
_highRSI_raw = RSIV1-50;
_lowRSI_raw = RSIV2-50;
_highRSI = max(_highRSI_raw, _lowRSI_raw);
_lowRSI = min(_highRSI_raw, _lowRSI_raw);
_close = (_openRSI + _highRSI + _lowRSI + _closeRSI) / 4;
_open = iff(isnan(_open[i_smoothing]) == true, (_openRSI + _closeRSI) / 2 , (_open[1] * i_smoothing + _close[1]) / (i_smoothing + 1));
_high = max(_highRSI, max(_open, _close));
_low = min(_lowRSI, min(_open, _close));
bodyColour = iff(_close > _open , i_colUp , i_colDown);
wickColour = i_colWick;
var1 = TL_New_Self(sDate,sTime,_open,sDate,sTime,_close);
var2 = TL_New_Self(sDate,sTime,_high,sDate,sTime,max(_open,_close));
var3 = TL_New_Self(sDate,sTime,_Low,sDate,sTime,min(_open,_close));
TL_SetColor(var1,bodyColour);
TL_SetColor(var2,i_colWick);
TL_SetColor(var2,i_colWick);
TL_SetSize(var1,3);
TL_SetSize(var2,1);
TL_SetSize(var3,1);
즐거운 하루되세요
> 당일선물 님이 쓴 글입니다.
> 제목 : 지표수식 변환 요청드립니다
> 수식변환 요청드립니다.
아래수식은 트레이딩뷰 지표식인데 이미지파일 그림처럼 캔들로 구현하지 못하더라도
HARSI 바디 시가 종가 고가 저가 를 선으로 출력되어도 됩니다
##=======// //@version=5
//@author=JayRogers
indicator('Heikin Ashi RSI Oscillator', 'HARSI •', false, format.price, 2)
string TT_HARSI = 'Period for the RSI calculations used to generate the' + 'candles. This seperate from the RSI plot/histogram length.'
string TT_PBIAS = 'Smoothing feature for the OPEN of the HARSI candles.' + '
Increases bias toward the prior open value which can' + ' help provide better visualisation of trend strength.' + '
** By changing the Open values, High and Low can also' + ' be distorted - however Close will remain unchanged.'
string TT_SMRSI = 'This option smoothes the RSI in a manner similar to HA' + ' open, but uses the realtime rsi rather than the prior' + ' close value.'
///////////////////////////////////////////////////////////////////////
// //
// ====== INPUTS ====== //
// //
////////////////////////////////////////////////////////////////////////////////
// -- Candle config
string GROUP_CAND = 'Config » HARSI Candles'
i_lenHARSI = input.int(14, 'Length', group=GROUP_CAND, minval=1, tooltip=TT_HARSI)
i_smoothing = input.int(7, 'Open Smoothing', group=GROUP_CAND, minval=1, maxval=100, tooltip=TT_PBIAS)
string INLINE_COL = 'Colour Pallette'
i_colUp = input.color(color.red, 'Colour Pallette  ', group=GROUP_CAND, inline=INLINE_COL)
i_colDown = input.color(color.teal, ' ', group=GROUP_CAND, inline=INLINE_COL)
i_colWick = input.color(color.gray, ' ', group=GROUP_CAND, inline=INLINE_COL)
// -- RSI plot config
string GROUP_PLOT = 'Config » RSI Plot'
i_source = input.source(ohlc4, 'Source', group=GROUP_PLOT)
i_lenRSI = input.int(7, 'Length', group=GROUP_PLOT, minval=1)
i_mode = input.bool(true, 'Smoothed Mode RSI?', group=GROUP_PLOT, tooltip=TT_SMRSI)
////////////////////////////////////////////////////////////////////////////////
// //
// ====== FUNCTIONS ====== //
// //
////////////////////////////////////////////////////////////////////////////////
// zero median rsi helper function, just subtracts 50.
f_zrsi(_source, _length) =>
ta.rsi(_source, _length) - 50
// mode 셀렉타블 rsi function for standard, or smoothed output
f_rsi(_source, _length, _mode) =>
// get base rsi
float _zrsi = f_zrsi(_source, _length)
// smoothing in a manner similar to HA open, but rather using the realtime
// rsi in place of the prior close value.
var float _smoothed = na
_smoothed := na(_smoothed[1]) ? _zrsi : (_smoothed[1] + _zrsi) / 2
// return the requested mode
_mode ? _smoothed : _zrsi
// RSI Heikin-Ashi generation function
f_rsiHeikinAshi(_length) =>
// get close rsi
float _closeRSI = f_zrsi(close, _length)
// emulate "open" simply by taking the previous close rsi value
float _openRSI = nz(_closeRSI[1], _closeRSI)
// the high and low are tricky, because unlike "high" and "low" by
// themselves, the RSI results can overlap each other. So first we just go
// ahead and get the raw results for high and low, and then..
float _highRSI_raw = f_zrsi(high, _length)
float _lowRSI_raw = f_zrsi(low, _length)
// ..make sure we use the highest for high, and lowest for low
float _highRSI = math.max(_highRSI_raw, _lowRSI_raw)
float _lowRSI = math.min(_highRSI_raw, _lowRSI_raw)
// ha calculation for close
float _close = (_openRSI + _highRSI + _lowRSI + _closeRSI) / 4
// ha calculation for open, standard, and smoothed/lagged
var float _open = na
_open := na(_open[i_smoothing]) ? (_openRSI + _closeRSI) / 2 : (_open[1] * i_smoothing + _close[1]) / (i_smoothing + 1)
// ha high and low min-max 섹렉션
float _high = math.max(_highRSI, math.max(_open, _close))
float _low = math.min(_lowRSI, math.min(_open, _close))
// return the OHLC values
[_open, _high, _low, _close]
////////////////////////////////////////////////////////////////////////////////
// //
// ====== SERIES, LINES and LABELS ====== //
// //
////////////////////////////////////////////////////////////////////////////////
// standard, or ha smoothed rsi for the line plot and/or histogram
float RSI = f_rsi(i_source, i_lenRSI, i_mode)
// get OHLC values to use in the plotcandle()
[O, H, L, C] = f_rsiHeikinAshi(i_lenHARSI)
// candle body colouring
color bodyColour = C > O ? i_colUp : i_colDown
color wickColour = i_colWick
// make our HA rsi candles
plotcandle(O, H, L, C, 'HARSI', bodyColour, wickColour, bordercolor=bodyColour)