커뮤니티
문의 드립니다

2023-02-24 11:33:22
1364
글번호 166654
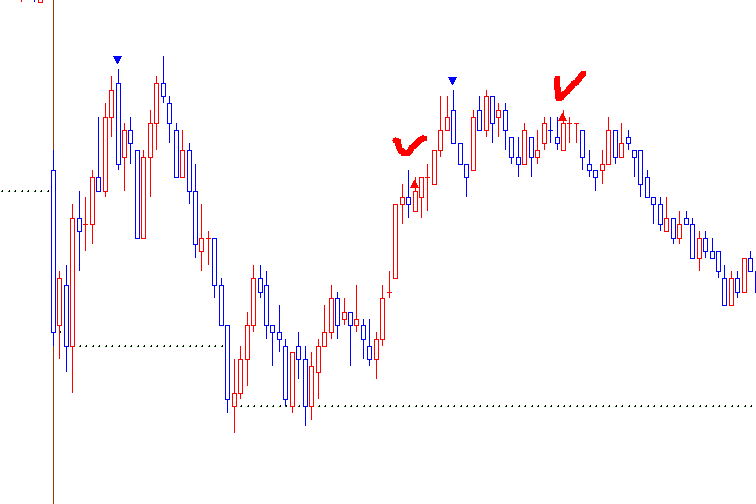
첨부 이미지
그림1

수고 하십니다.
아래 지표식에서 매수 신호가 봉 위에 표시 되네요...
봉 아래에 위치하게 변경 부탁드립니다.
수고 하세요...
//////////////
input : Period(20),P(5);
input : Per1(120),Per2(130);
Var : Bearish(False),Bullish(False),tx(0);
var1 = ma(C,Period);
var2 = abs(C-O);
Var3 = ma(Var2,P);
Bearish = var1 > var1[1] AND Close < Open AND Close[1] > Open[1] AND Close < Open[1] AND Open > Close[1];
Bullish = var1 > var1[1] AND Close > Open AND Close[1] < Open[1] AND Close > Open[1] AND Open < Close[1];
if Bearish == true and Var2 > Var3[1]*(1+per1/100) then
{
tx = Text_New(sDate,sTime,H,"▼");
Text_SetStyle(tx,2,1);
Text_SetColor(tx,Blue);
}
if Bullish == true and Var2 > Var3[1]*(1+per2/100) then
{
tx = Text_New(sDate,sTime,H,"▲");
Text_SetStyle(tx,2,0);
Text_SetColor(tx,Red);
}
- 1. engulfing.png (0.02 MB)
답변 1

예스스탁 예스스탁 답변
2023-02-24 11:53:08
안녕하세요
예스스탁입니다.
저가 위치로 수정했습니다.
input : Period(20),P(5);
input : Per1(120),Per2(130);
Var : Bearish(False),Bullish(False),tx(0);
var1 = ma(C,Period);
var2 = abs(C-O);
Var3 = ma(Var2,P);
Bearish = var1 > var1[1] AND Close < Open AND Close[1] > Open[1] AND Close < Open[1] AND Open > Close[1];
Bullish = var1 > var1[1] AND Close > Open AND Close[1] < Open[1] AND Close > Open[1] AND Open < Close[1];
if Bearish == true and Var2 > Var3[1]*(1+per1/100) then
{
tx = Text_New(sDate,sTime,H,"▼");
Text_SetStyle(tx,2,1);
Text_SetColor(tx,Blue);
}
if Bullish == true and Var2 > Var3[1]*(1+per2/100) then
{
tx = Text_New(sDate,sTime,L,"▲");
Text_SetStyle(tx,2,0);
Text_SetColor(tx,Red);
}
즐거운 하루되세요
> 오이도인 님이 쓴 글입니다.
> 제목 : 문의 드립니다
> 수고 하십니다.
아래 지표식에서 매수 신호가 봉 위에 표시 되네요...
봉 아래에 위치하게 변경 부탁드립니다.
수고 하세요...
//////////////
input : Period(20),P(5);
input : Per1(120),Per2(130);
Var : Bearish(False),Bullish(False),tx(0);
var1 = ma(C,Period);
var2 = abs(C-O);
Var3 = ma(Var2,P);
Bearish = var1 > var1[1] AND Close < Open AND Close[1] > Open[1] AND Close < Open[1] AND Open > Close[1];
Bullish = var1 > var1[1] AND Close > Open AND Close[1] < Open[1] AND Close > Open[1] AND Open < Close[1];
if Bearish == true and Var2 > Var3[1]*(1+per1/100) then
{
tx = Text_New(sDate,sTime,H,"▼");
Text_SetStyle(tx,2,1);
Text_SetColor(tx,Blue);
}
if Bullish == true and Var2 > Var3[1]*(1+per2/100) then
{
tx = Text_New(sDate,sTime,H,"▲");
Text_SetStyle(tx,2,0);
Text_SetColor(tx,Red);
}