커뮤니티
수식수정

2023-07-09 16:29:32
1563
글번호 170453
첨부 이미지
그림1

Inputs : Period(20), CC_DN(Yellow);
var : 기준선기간(26);
Vars:
VLineUp(0),
VLineDn(0),
HHighest(0),
LLowest(0),
JustChanged(FALSE),
VLine(0), DBN(0),T(0);
Array:
Highs[35](0),
Lows[35](0),
RRange[35](0),
UpWave[1](FALSE),
DnWave[1](FALSE);
If STime == 180000 Then
DBN = 0;
DBN = DBN + 1;
Var1 = Period;
Var2 = Var1 - 1;
Var3 = Var1 - 2;
Var6 = H-L;
JustChanged = FALSE;
if CurrentBar <= Var2 then begin
Highs[CurrentBar] = Close;
Lows[CurrentBar] = Close;
RRange[CurrentBar] = (H-L) /2;
end;
if CurrentBar == Var1 then begin
if Highs[Var2] >= Highs[Var3] then begin
UpWave[1] = TRUE;
HHighest = Highs[Var2];
VLineUp = HHighest - (Var5 * MA(Var6,Var2));
#Plot1(VLineUp,"VLineUp");
end;
if Highs[Var2] < Highs[Var3] then begin
DnWave[1] = TRUE;
LLowest = Lows[Var2];
VLineDn = LLowest + (Var5 * MA(Var6,Var2));
#Plot2(VLineDn,"VLineDn");
end;
end;
if CurrentBar > Var1 then begin
if DnWave[1] and Close > VLineDn then begin
DnWave[1] = FALSE;
UpWave[1] = TRUE;
JustChanged = TRUE;
HHighest = Close;
LLowest = 0;
end;
if UpWave[1] and Close < VLineUp and JustChanged == FALSE then begin
UpWave[1] = FALSE;
DnWave[1] = TRUE;
JustChanged = TRUE;
LLowest = Close;
HHighest = 0;
end;
if JustChanged == FALSE then begin
if Close > HHighest then
HHighest = Close;
else if Close < LLowest then
LLowest = Close;
end;
VLineUp = HHighest - (Var5 * MA(Var6,Var2));
VLineDn = LLowest + (Var5 * MA(Var6,Var2));
if UpWave[1] then T = 1;
else if DnWave[1] then T = -1;
end;
Input : 당일수익틱수(100);
input : StartTime(70000),EndTime(55000);
Var : N1(0),dayPl(0),당일수익(0),Xcond(false);
var : Tcond(False);
IF Endtime > starttime Then
SetStopEndofday(Endtime);
Else
{
if sDate != sDate[1] Then
SetStopEndofday(Endtime);
}
if (sdate != sdate[1] and stime >= EndTime) or
(sdate == sdate[1] and stime >= EndTime and stime[1] < EndTime) Then
{
Tcond = False;
}
if (sdate != sdate[1] and stime >= StartTime) or
(sdate == sdate[1] and stime >= StartTime and stime[1] < StartTime) Then
{
Tcond = true;
Xcond = false;
N1 = NetProfit;
IF Endtime <= starttime Then
{
SetStopEndofday(0);
}
}
당일수익 = PriceScale*당일수익틱수;
daypl = NetProfit-N1;
if TotalTrades > TotalTrades[1] then
{
if daypl >= 당일수익 Then
Xcond = true;
if (IsExitName("dbp",1) == true or IsExitName("dsp",1) == true) then
Xcond = true;
}
if Tcond == true and Xcond == False Then
{
if t == 1 and C > DayClose(1) Then
Buy();
if t == -1 and C < DayClose(1) Then
Sell();
if MarketPosition == 1 then
{
ExitLong("dbp",atlimit,EntryPrice+((당일수익-daypl)/CurrentContracts));
}
if MarketPosition == -1 then
{
ExitShort("dsp",atlimit,EntryPrice-((당일수익-daypl)/CurrentContracts));
}
}
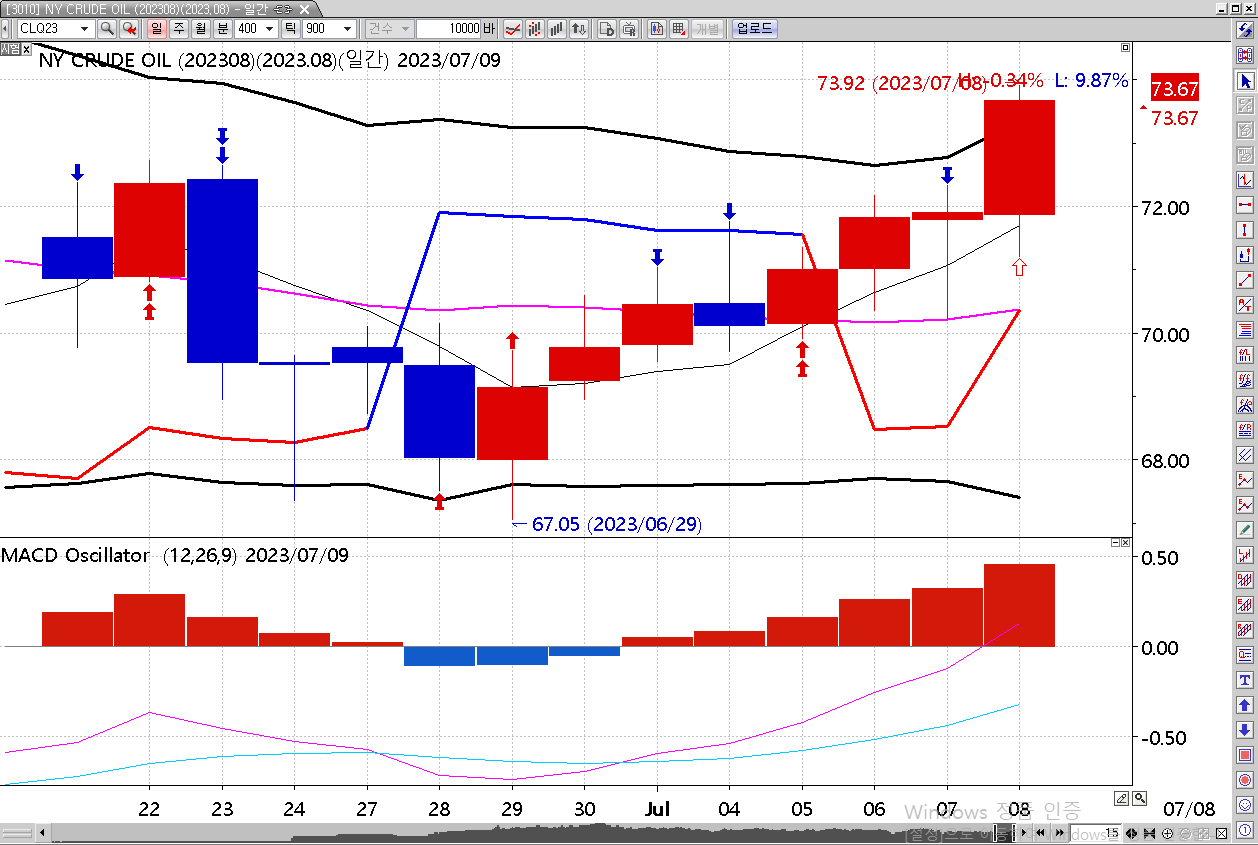
안녕하세요
위식을 일봉에 적용결과 일봉상 신호가
매일 나오지 않고 건너뜀
수정
Date 2 추가 30분봉
일봉상 전일 종가 기준선 중심으로
Date2 양봉이고
date 1 시가가 전일종가 보다5틱이상 상승시 매수진입
Date2음봉이고
Dste1
시가가 전일종가 보다 5틱이상 하락시 매도진입.
매수후 장중에 기준선 중심으로
등락시 매수.매도 반복함.
- 1. 오일일봉_.png (0.07 MB)
답변 1

예스스탁 예스스탁 답변
2023-07-10 11:06:24
안녕하세요
예스스탁입니다.
수식에 시간조건이나 당일청산이 들어가면
분봉이하의 주기에 적용해야 하는 내용이 됩니다.
또한 수식의 if문은 기본차트 봉완성기준입니다.
장중에 등락으로 매수매도 반복하게 할 수 없습니다.
즐거운 하루되세요
> 아트정 님이 쓴 글입니다.
> 제목 : 수식수정
> Inputs : Period(20), CC_DN(Yellow);
var : 기준선기간(26);
Vars:
VLineUp(0),
VLineDn(0),
HHighest(0),
LLowest(0),
JustChanged(FALSE),
VLine(0), DBN(0),T(0);
Array:
Highs[35](0),
Lows[35](0),
RRange[35](0),
UpWave[1](FALSE),
DnWave[1](FALSE);
If STime == 180000 Then
DBN = 0;
DBN = DBN + 1;
Var1 = Period;
Var2 = Var1 - 1;
Var3 = Var1 - 2;
Var6 = H-L;
JustChanged = FALSE;
if CurrentBar <= Var2 then begin
Highs[CurrentBar] = Close;
Lows[CurrentBar] = Close;
RRange[CurrentBar] = (H-L) /2;
end;
if CurrentBar == Var1 then begin
if Highs[Var2] >= Highs[Var3] then begin
UpWave[1] = TRUE;
HHighest = Highs[Var2];
VLineUp = HHighest - (Var5 * MA(Var6,Var2));
#Plot1(VLineUp,"VLineUp");
end;
if Highs[Var2] < Highs[Var3] then begin
DnWave[1] = TRUE;
LLowest = Lows[Var2];
VLineDn = LLowest + (Var5 * MA(Var6,Var2));
#Plot2(VLineDn,"VLineDn");
end;
end;
if CurrentBar > Var1 then begin
if DnWave[1] and Close > VLineDn then begin
DnWave[1] = FALSE;
UpWave[1] = TRUE;
JustChanged = TRUE;
HHighest = Close;
LLowest = 0;
end;
if UpWave[1] and Close < VLineUp and JustChanged == FALSE then begin
UpWave[1] = FALSE;
DnWave[1] = TRUE;
JustChanged = TRUE;
LLowest = Close;
HHighest = 0;
end;
if JustChanged == FALSE then begin
if Close > HHighest then
HHighest = Close;
else if Close < LLowest then
LLowest = Close;
end;
VLineUp = HHighest - (Var5 * MA(Var6,Var2));
VLineDn = LLowest + (Var5 * MA(Var6,Var2));
if UpWave[1] then T = 1;
else if DnWave[1] then T = -1;
end;
Input : 당일수익틱수(100);
input : StartTime(70000),EndTime(55000);
Var : N1(0),dayPl(0),당일수익(0),Xcond(false);
var : Tcond(False);
IF Endtime > starttime Then
SetStopEndofday(Endtime);
Else
{
if sDate != sDate[1] Then
SetStopEndofday(Endtime);
}
if (sdate != sdate[1] and stime >= EndTime) or
(sdate == sdate[1] and stime >= EndTime and stime[1] < EndTime) Then
{
Tcond = False;
}
if (sdate != sdate[1] and stime >= StartTime) or
(sdate == sdate[1] and stime >= StartTime and stime[1] < StartTime) Then
{
Tcond = true;
Xcond = false;
N1 = NetProfit;
IF Endtime <= starttime Then
{
SetStopEndofday(0);
}
}
당일수익 = PriceScale*당일수익틱수;
daypl = NetProfit-N1;
if TotalTrades > TotalTrades[1] then
{
if daypl >= 당일수익 Then
Xcond = true;
if (IsExitName("dbp",1) == true or IsExitName("dsp",1) == true) then
Xcond = true;
}
if Tcond == true and Xcond == False Then
{
if t == 1 and C > DayClose(1) Then
Buy();
if t == -1 and C < DayClose(1) Then
Sell();
if MarketPosition == 1 then
{
ExitLong("dbp",atlimit,EntryPrice+((당일수익-daypl)/CurrentContracts));
}
if MarketPosition == -1 then
{
ExitShort("dsp",atlimit,EntryPrice-((당일수익-daypl)/CurrentContracts));
}
}
안녕하세요
위식을 일봉에 적용결과 일봉상 신호가
매일 나오지 않고 건너뜀
수정
Date 2 추가 30분봉
일봉상 전일 종가 기준선 중심으로
Date2 양봉이고
date 1 시가가 전일종가 보다5틱이상 상승시 매수진입
Date2음봉이고
Dste1
시가가 전일종가 보다 5틱이상 하락시 매도진입.
매수후 장중에 기준선 중심으로
등락시 매수.매도 반복함.
다음글