커뮤니티
지표문의

2023-09-26 02:03:10
1370
글번호 172744
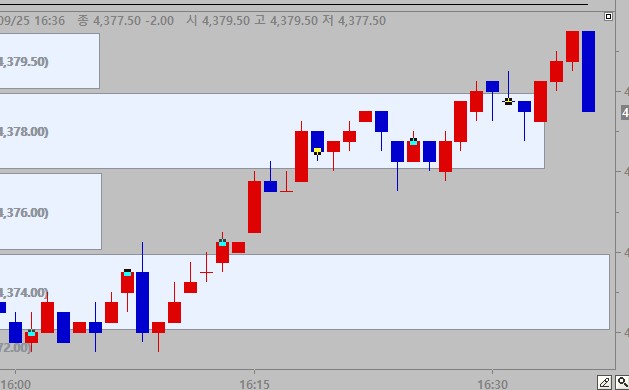
첨부 이미지
그림1

1.아래는 매물대인데 첨부 파일 처럼 구간을 색상을 넣어 구분하는데
첨부파일 처럼 보이게 수정 좀 해주세요.
2.그리구 각 구간 중간값 선을 넣어주세요 힌색선으로
Input:Period(20);
Input:계산시작일(20230907), // 차트 처음부터 계산하려면 0을 입력
차트반영일(20230907),
연장여부(1),
매물대개수(10),
수치표시(1),
추세선간격(4);
Var:j(0),jj(0),Continue(True),sBar(0),eBar(0),출력매물대개수(0),sIndex(0),Length(0),
TitleBar(0), // 차트
제목을 화면에 출력하기 위한 좌표TitlePrice(0),
TitleName(""); // 차트 제목
Array:VolProfileArr[100,5](0),
TL[100,4](0),Text[101](0);
#==========================================#
IF 매물대개수 > 98 Then {
Alert("매물대개수는 98까지만 허용합니다.");
Continue = False;
}
If Continue Then {
#----------------------------------------------------------------------------------#
# 시작하기
#----------------------------------------------------------------------------------#
Value1 = 0;
If (Date[1] < 계산시작일 and Date >= 계산시작일) or // 계산시작일이 있으면 날짜 통과 시점에
(계산시작일 == 0 and Index == 0) Then { // 계산시작일이 0이면 첫번째 봉부터
sIndex = Index; // 계산시작일로부터의 봉개수를 계산하기 위해 Index를 저장
}
If (Date[1] < 차트반영일 and Date >= 차트반영일) or
(Date >= 차트반영일 and 연장여부 > 0) Then {
Length = Index - sIndex + 1;
Value1 = 총거래량 + V;
}
If Value1 == 1 Then {
For j = 1 To 출력매물대개수[1] { // 싹다 지우고 다시 그린다.
For jj = 1 To 4 {
TL_Delete(TL[j,jj]);
}
If 수치표시 > 0 Then Text_Delete(Text[j]);
}
For j = 1 To 출력매물대개수 {
If 총거래량 + V > 0 Then {
sBar = 총거래량 + V;
eBar = 0;
TL[j,1] = TL_New(sDate[sBar],sTime[sBar],VolProfileArr[j,1] + 추세선간격 * PriceScale,sDate[eBar],sTime[eBar],VolProfileArr[j,1] + 추세선간격 * PriceScale);
TL[j,2] = TL_New(sDate[sBar],sTime[sBar],VolProfileArr[j,2] - 추세선간격 * PriceScale,sDate[eBar],sTime[eBar],VolProfileArr[j,2] - 추세선간격 * PriceScale);
TL[j,3] = TL_New(sDate[sBar],sTime[sBar],VolProfileArr[j,1] + 추세선간격 * PriceScale,sDate[sBar],sTime[sBar],VolProfileArr[j,2] - 추세선간격 * PriceScale);
}
TL[j,4] = TL_New(sDate[0],sTime[0],VolProfileArr[j,1] + 추세선간격 * PriceScale,
sDate[0],sTime[0],VolProfileArr[j,2] - 추세선간격 * PriceScale);
If 수치표시 > 0 Then {
Text[j] = Text_New(sDate[0],stime[0],(VolProfileArr[j,1] + VolProfileArr[j,2]) / 2, NumToStr(VolProfileArr[j,4],0) + " (" + NumToStr(VolProfileArr[j,5],2) + "%)(" + NumToStr(VolProfileArr[j,1],0) + " ~ " + NumToStr(VolProfileArr[j,2],0) + ")");
Text_SetStyle(Text[j], 1, 2);
}
}
Text_Delete(Text[0]);
sBar = TitleBar;
Text[0] = Text_New(sDate[sBar], stime[sBar],TitlePrice,TitleName);
Text_SetStyle(Text[0], 2, 1);
}
}
plot1(Value1);
//Plot2(ma(C,Period), "이동평균1");
2.그럼 수고하세요
- 1. 매물대.jpg (0.03 MB)
답변 1

예스스탁 예스스탁 답변
2023-09-26 13:53:27
안녕하세요
예스스탁입니다.
문의하신 내용으로 가능하지 않습니다.
도움을 드리지 못해 죄송합니다.
즐거운 명절되세요
> 성공예견 님이 쓴 글입니다.
> 제목 : 지표문의
> 1.아래는 매물대인데 첨부 파일 처럼 구간을 색상을 넣어 구분하는데
첨부파일 처럼 보이게 수정 좀 해주세요.
2.그리구 각 구간 중간값 선을 넣어주세요 힌색선으로
Input:Period(20);
Input:계산시작일(20230907), // 차트 처음부터 계산하려면 0을 입력
차트반영일(20230907),
연장여부(1),
매물대개수(10),
수치표시(1),
추세선간격(4);
Var:j(0),jj(0),Continue(True),sBar(0),eBar(0),출력매물대개수(0),sIndex(0),Length(0),
TitleBar(0), // 차트
제목을 화면에 출력하기 위한 좌표TitlePrice(0),
TitleName(""); // 차트 제목
Array:VolProfileArr[100,5](0),
TL[100,4](0),Text[101](0);
#==========================================#
IF 매물대개수 > 98 Then {
Alert("매물대개수는 98까지만 허용합니다.");
Continue = False;
}
If Continue Then {
#----------------------------------------------------------------------------------#
# 시작하기
#----------------------------------------------------------------------------------#
Value1 = 0;
If (Date[1] < 계산시작일 and Date >= 계산시작일) or // 계산시작일이 있으면 날짜 통과 시점에
(계산시작일 == 0 and Index == 0) Then { // 계산시작일이 0이면 첫번째 봉부터
sIndex = Index; // 계산시작일로부터의 봉개수를 계산하기 위해 Index를 저장
}
If (Date[1] < 차트반영일 and Date >= 차트반영일) or
(Date >= 차트반영일 and 연장여부 > 0) Then {
Length = Index - sIndex + 1;
Value1 = 총거래량 + V;
}
If Value1 == 1 Then {
For j = 1 To 출력매물대개수[1] { // 싹다 지우고 다시 그린다.
For jj = 1 To 4 {
TL_Delete(TL[j,jj]);
}
If 수치표시 > 0 Then Text_Delete(Text[j]);
}
For j = 1 To 출력매물대개수 {
If 총거래량 + V > 0 Then {
sBar = 총거래량 + V;
eBar = 0;
TL[j,1] = TL_New(sDate[sBar],sTime[sBar],VolProfileArr[j,1] + 추세선간격 * PriceScale,sDate[eBar],sTime[eBar],VolProfileArr[j,1] + 추세선간격 * PriceScale);
TL[j,2] = TL_New(sDate[sBar],sTime[sBar],VolProfileArr[j,2] - 추세선간격 * PriceScale,sDate[eBar],sTime[eBar],VolProfileArr[j,2] - 추세선간격 * PriceScale);
TL[j,3] = TL_New(sDate[sBar],sTime[sBar],VolProfileArr[j,1] + 추세선간격 * PriceScale,sDate[sBar],sTime[sBar],VolProfileArr[j,2] - 추세선간격 * PriceScale);
}
TL[j,4] = TL_New(sDate[0],sTime[0],VolProfileArr[j,1] + 추세선간격 * PriceScale,
sDate[0],sTime[0],VolProfileArr[j,2] - 추세선간격 * PriceScale);
If 수치표시 > 0 Then {
Text[j] = Text_New(sDate[0],stime[0],(VolProfileArr[j,1] + VolProfileArr[j,2]) / 2, NumToStr(VolProfileArr[j,4],0) + " (" + NumToStr(VolProfileArr[j,5],2) + "%)(" + NumToStr(VolProfileArr[j,1],0) + " ~ " + NumToStr(VolProfileArr[j,2],0) + ")");
Text_SetStyle(Text[j], 1, 2);
}
}
Text_Delete(Text[0]);
sBar = TitleBar;
Text[0] = Text_New(sDate[sBar], stime[sBar],TitlePrice,TitleName);
Text_SetStyle(Text[0], 2, 1);
}
}
plot1(Value1);
//Plot2(ma(C,Period), "이동평균1");
2.그럼 수고하세요