커뮤니티
수고하십니다

2024-11-05 12:00:39
1075
글번호 184975
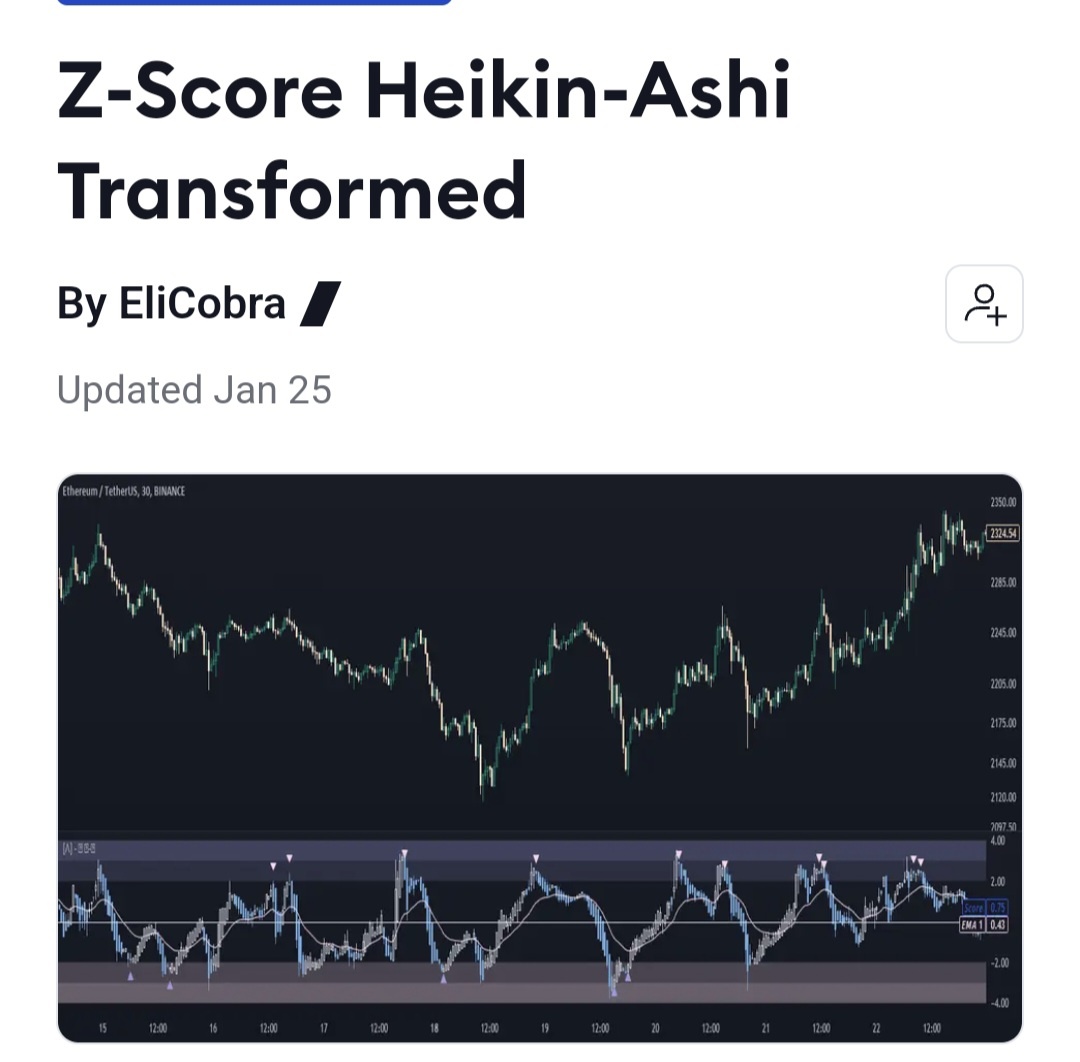
첨부 이미지
그림1

항상 수고에 감사드리며
변환 부탁드립니다
//@version=5
indicator("Z-Score Heikin Ashi Transformed", "[Ʌ] - 𝘡 𝘏-𝘈", false)
type bar
float o = open
float h = high
float l = low
float c = close
type alerts
bool s = na
bool b = na
bool u = na
bool d = na
bool p = na
bool n = na
bool x = na
bool y = na
type prompt
string s = ''
bool c = false
method notify(prompt p) =>
if p.c
alert(p.s, alert.freq_once_per_bar_close)
method any(alerts a) =>
string s = switch
a.s => 'OB Signal'
a.b => 'OS Signal'
a.u => 'Bullish Trend'
a.d => 'Bearish Trend'
a.p => 'Heikin-Ashi Uptrend '
a.n => 'Heikin-Ashi Downtrend'
a.x => 'MACD Bullish Cross'
a.y => 'MACD Bearish Cross'
=> na
prompt.new(s, not na(s))
method src(bar b, simple string src) =>
float x = switch src
'oc2' => math.avg(b.o, b.c )
'hl2' => math.avg(b.h, b.l )
'hlc3' => math.avg(b.h, b.l, b.c )
'ohlc4' => math.avg(b.o, b.h, b.l, b.c)
'hlcc4' => math.avg(b.h, b.l, b.c, b.c)
x
method ha(bar b, simple bool p = true) =>
var bar x = bar.new( )
x.c := b .src('ohlc4')
x := bar.new(
na(x.o[1]) ?
b.src('oc2') : nz(x.src('oc2')[1]),
math.max(b.h, math.max(x.o, x.c)) ,
math.min(b.l, math.min(x.o, x.c)) ,
x.c )
p ? x : b
f_z(float src, simple int len) =>
(src - ta.sma(src, len)) / ta.stdev(src, len)
method z(bar b, simple int len) =>
bar x = bar.new(
f_z(b.o, len),
f_z(b.h, len),
f_z(b.l, len),
f_z(b.c, len))
x
const string gz = "Z-Score", const string ge = "EMAs"
len = input.int (21 , "Z Period" , group = gz)
revs = input.bool (true , "Reversions" , inline = '0', group = gz)
revt = input.int (2 , "Threshold" , [1, 2, 3], inline = '0', group = gz)
hol = input.bool (true , "Hollow Candles", group = gz)
ma1 = input.bool (true , "EMA |" , inline = '1', group = ge)
len1 = input.int (20 , "Length" , inline = '1', group = ge)
ma2 = input.bool (false , "EMA |" , inline = '2', group = ge)
len2 = input.int (50 , "Length" , inline = '2', group = ge)
col1 = input.color(#FFD6E8, "" , inline = '3', group = ge)
col2 = input.color(#9a9adf, "" , inline = '3', group = ge)
bar score = bar.new().ha().z(len)
var color colup = chart.fg_color
const color coldn = #6fa8dc
color haColor = switch
score.c > score.o => colup
score.c < score.o => coldn
plotcandle(score.o, score.h, score.l, score.c, "𝘚𝘤𝘰𝘳𝘦",
hol ? score.c < score.o ? haColor : na : haColor, haColor, bordercolor = haColor)
m = hline(0 , "Mid Line", chart.fg_color, hline.style_solid)
min = hline(-4 , display = display.none )
ll = hline(-3 , display = display.none )
hl = hline(-2 , display = display.none )
max = hline(+4 , display = display.none )
hh = hline(+3 , display = display.none )
lh = hline(+2 , display = display.none )
e1 = plot (ma1 ? ta.ema(score.c, len1) : na, "𝘌𝘔𝘈 1" , col1 )
e2 = plot (ma2 ? ta.ema(score.c, len2) : na, "𝘌𝘔𝘈 2" , col2 )
fill(lh, hh , color = #9a9adf2a)
fill(hh, max, color = #9a9adf4d)
fill(ll, hl , color = #ffd6e83b)
fill(ll, min, color = #ffd6e85e)
alerts a = alerts.new(
ta.crossunder(score.c, score.o) and (score.h > revt),
ta.crossover (score.c, score.o) and (score.l < -revt),
ta.crossover (score.c, 0) ,
ta.crossunder(score.c, 0) ,
ta.crossunder(score.c, score.o) and not (score.h > revt),
ta.crossover (score.c, score.o) and not (score.l < -revt),
ta.crossover (score.c, ta.ema(score.c, len1)) ,
ta.crossunder(score.c, ta.ema(score.c, len1)) )
plotshape(revs ? a.s ? score.h + 0.75 : na : na, "OB", shape.triangledown, location.absolute, col1, size = size.tiny)
plotshape(revs ? a.b ? score.l - 0.75 : na : na, "OS", shape.triangleup , location.absolute, col2, size = size.tiny)
alertcondition(a.s, "Overbought" , 'OB Signal' )
alertcondition(a.b, "Oversold " , 'OS Signal' )
alertcondition(a.u, "Midline Crossover " , 'Bullish Trend' )
alertcondition(a.d, "Midline Crossunder" , 'Bearish Trend' )
alertcondition(a.p, "Positive Heikin-Ashi", 'Heikin-Ashi Uptrend ')
alertcondition(a.n, "Negative Heikin-Ashi", 'Heikin-Ashi Downtrend')
alertcondition(a.x, "EMA Bull Cross" , 'EMA Bullish Cross' )
alertcondition(a.y, "EMA Bear Cross" , 'EMA Bearish Cross' )
a.any().notify()
//Source Construction For Indicator₩Strategy Exports
plot(score.o , "open" , editable = false, display = display.none)
plot(score.h , "high" , editable = false, display = display.none)
plot(score.l , "low" , editable = false, display = display.none)
plot(score.c , "close", editable = false, display = display.none)
plot(score.src('hl2' ), "hl2" , editable = false, display = display.none)
plot(score.src('hlc3' ), "hlc3" , editable = false, display = display.none)
plot(score.src('ohlc4'), "ohlc4", editable = false, display = display.none)
plot(score.src('hlcc4'), "hlcc4", editable = false, display = display.none)
- 1. KakaoTalk_20241105_115921346.jpg (0.13 MB)
답변 1

예스스탁 예스스탁 답변
2024-11-05 16:06:51
안녕하세요
예스스탁입니다.
올려주신 수식은 변환해 드리기 어렵습니다.
전체 내용이 모두 독해되어야 변환해 드릴 수 있는데
해당 언어에 익숙하지 않아 내용 파악이 어려운 부분이 있습니다.
도움을 드리지 못해 죄송합니다.
즐거운 하루되세요
> 비듬싸순 님이 쓴 글입니다.
> 제목 : 수고하십니다
>
항상 수고에 감사드리며
변환 부탁드립니다
//@version=5
indicator("Z-Score Heikin Ashi Transformed", "[Ʌ] - 𝘡 𝘏-𝘈", false)
type bar
float o = open
float h = high
float l = low
float c = close
type alerts
bool s = na
bool b = na
bool u = na
bool d = na
bool p = na
bool n = na
bool x = na
bool y = na
type prompt
string s = ''
bool c = false
method notify(prompt p) =>
if p.c
alert(p.s, alert.freq_once_per_bar_close)
method any(alerts a) =>
string s = switch
a.s => 'OB Signal'
a.b => 'OS Signal'
a.u => 'Bullish Trend'
a.d => 'Bearish Trend'
a.p => 'Heikin-Ashi Uptrend '
a.n => 'Heikin-Ashi Downtrend'
a.x => 'MACD Bullish Cross'
a.y => 'MACD Bearish Cross'
=> na
prompt.new(s, not na(s))
method src(bar b, simple string src) =>
float x = switch src
'oc2' => math.avg(b.o, b.c )
'hl2' => math.avg(b.h, b.l )
'hlc3' => math.avg(b.h, b.l, b.c )
'ohlc4' => math.avg(b.o, b.h, b.l, b.c)
'hlcc4' => math.avg(b.h, b.l, b.c, b.c)
x
method ha(bar b, simple bool p = true) =>
var bar x = bar.new( )
x.c := b .src('ohlc4')
x := bar.new(
na(x.o[1]) ?
b.src('oc2') : nz(x.src('oc2')[1]),
math.max(b.h, math.max(x.o, x.c)) ,
math.min(b.l, math.min(x.o, x.c)) ,
x.c )
p ? x : b
f_z(float src, simple int len) =>
(src - ta.sma(src, len)) / ta.stdev(src, len)
method z(bar b, simple int len) =>
bar x = bar.new(
f_z(b.o, len),
f_z(b.h, len),
f_z(b.l, len),
f_z(b.c, len))
x
const string gz = "Z-Score", const string ge = "EMAs"
len = input.int (21 , "Z Period" , group = gz)
revs = input.bool (true , "Reversions" , inline = '0', group = gz)
revt = input.int (2 , "Threshold" , [1, 2, 3], inline = '0', group = gz)
hol = input.bool (true , "Hollow Candles", group = gz)
ma1 = input.bool (true , "EMA |" , inline = '1', group = ge)
len1 = input.int (20 , "Length" , inline = '1', group = ge)
ma2 = input.bool (false , "EMA |" , inline = '2', group = ge)
len2 = input.int (50 , "Length" , inline = '2', group = ge)
col1 = input.color(#FFD6E8, "" , inline = '3', group = ge)
col2 = input.color(#9a9adf, "" , inline = '3', group = ge)
bar score = bar.new().ha().z(len)
var color colup = chart.fg_color
const color coldn = #6fa8dc
color haColor = switch
score.c > score.o => colup
score.c < score.o => coldn
plotcandle(score.o, score.h, score.l, score.c, "𝘚𝘤𝘰𝘳𝘦",
hol ? score.c < score.o ? haColor : na : haColor, haColor, bordercolor = haColor)
m = hline(0 , "Mid Line", chart.fg_color, hline.style_solid)
min = hline(-4 , display = display.none )
ll = hline(-3 , display = display.none )
hl = hline(-2 , display = display.none )
max = hline(+4 , display = display.none )
hh = hline(+3 , display = display.none )
lh = hline(+2 , display = display.none )
e1 = plot (ma1 ? ta.ema(score.c, len1) : na, "𝘌𝘔𝘈 1" , col1 )
e2 = plot (ma2 ? ta.ema(score.c, len2) : na, "𝘌𝘔𝘈 2" , col2 )
fill(lh, hh , color = #9a9adf2a)
fill(hh, max, color = #9a9adf4d)
fill(ll, hl , color = #ffd6e83b)
fill(ll, min, color = #ffd6e85e)
alerts a = alerts.new(
ta.crossunder(score.c, score.o) and (score.h > revt),
ta.crossover (score.c, score.o) and (score.l < -revt),
ta.crossover (score.c, 0) ,
ta.crossunder(score.c, 0) ,
ta.crossunder(score.c, score.o) and not (score.h > revt),
ta.crossover (score.c, score.o) and not (score.l < -revt),
ta.crossover (score.c, ta.ema(score.c, len1)) ,
ta.crossunder(score.c, ta.ema(score.c, len1)) )
plotshape(revs ? a.s ? score.h + 0.75 : na : na, "OB", shape.triangledown, location.absolute, col1, size = size.tiny)
plotshape(revs ? a.b ? score.l - 0.75 : na : na, "OS", shape.triangleup , location.absolute, col2, size = size.tiny)
alertcondition(a.s, "Overbought" , 'OB Signal' )
alertcondition(a.b, "Oversold " , 'OS Signal' )
alertcondition(a.u, "Midline Crossover " , 'Bullish Trend' )
alertcondition(a.d, "Midline Crossunder" , 'Bearish Trend' )
alertcondition(a.p, "Positive Heikin-Ashi", 'Heikin-Ashi Uptrend ')
alertcondition(a.n, "Negative Heikin-Ashi", 'Heikin-Ashi Downtrend')
alertcondition(a.x, "EMA Bull Cross" , 'EMA Bullish Cross' )
alertcondition(a.y, "EMA Bear Cross" , 'EMA Bearish Cross' )
a.any().notify()
//Source Construction For Indicator₩Strategy Exports
plot(score.o , "open" , editable = false, display = display.none)
plot(score.h , "high" , editable = false, display = display.none)
plot(score.l , "low" , editable = false, display = display.none)
plot(score.c , "close", editable = false, display = display.none)
plot(score.src('hl2' ), "hl2" , editable = false, display = display.none)
plot(score.src('hlc3' ), "hlc3" , editable = false, display = display.none)
plot(score.src('ohlc4'), "ohlc4", editable = false, display = display.none)
plot(score.src('hlcc4'), "hlcc4", editable = false, display = display.none)
다음글
이전글