커뮤니티
수고하십니다

2024-12-19 00:05:22
710
글번호 186399
첨부 이미지
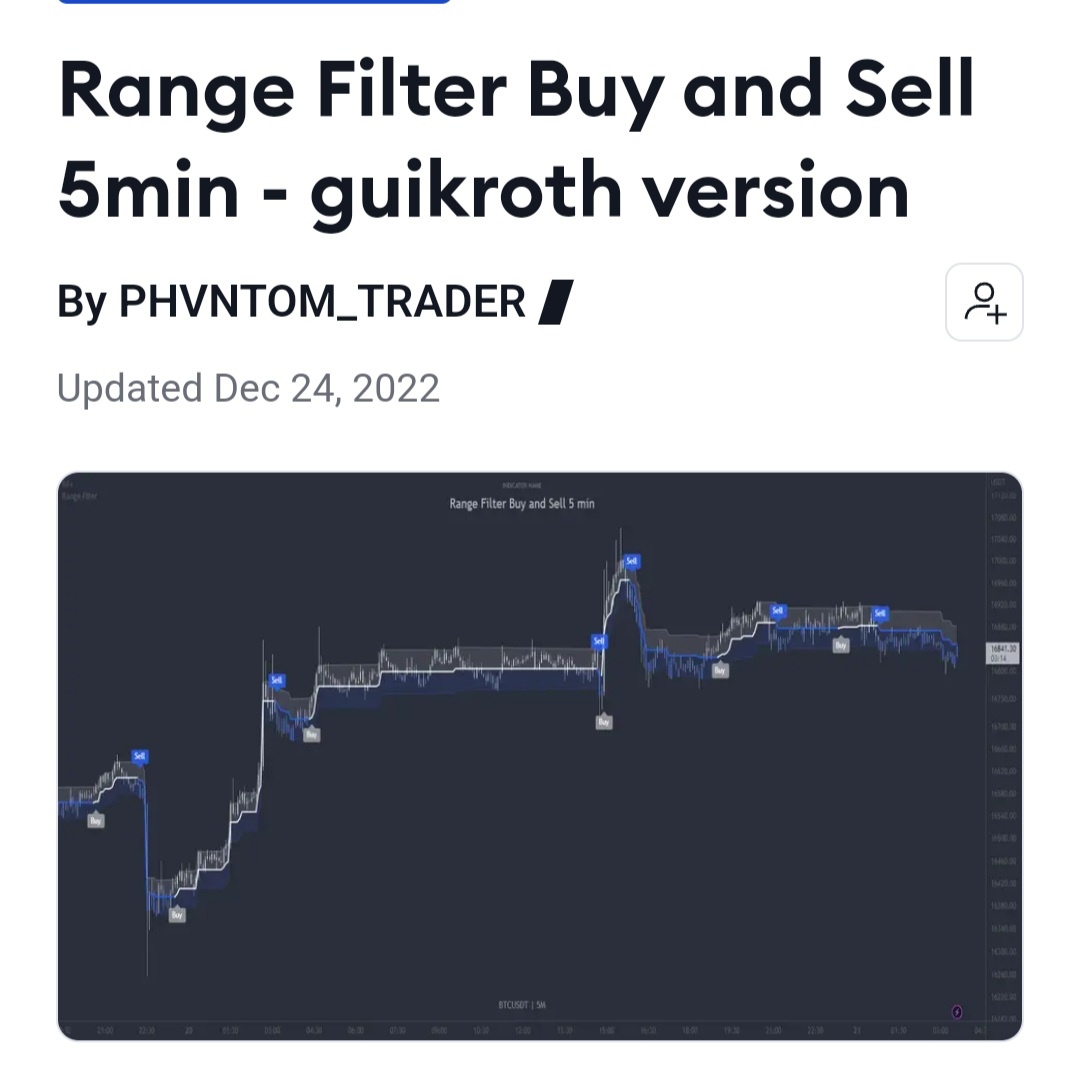
그림1

항상 노고에 감사드리며
변환 부탁드립니다
indicator(title="Range Filter Buy and Sell 5min", shorttitle="Range Filter", overlay=true)
// Color variables
upColor = color.white
midColor = #90bff9
downColor = color.blue
// Source
src = input(defval=close, title="Source")
// Sampling Period
// Settings for 5min chart, BTCUSDC. For Other coin, change the paremeters
per = input.int(defval=100, minval=1, title="Sampling Period")
// Range Multiplier
mult = input.float(defval=3.0, minval=0.1, title="Range Multiplier")
// Smooth Average Range
smoothrng(x, t, m) =>
wper = t * 2 - 1
avrng = ta.ema(math.abs(x - x[1]), t)
smoothrng = ta.ema(avrng, wper) * m
smoothrng
smrng = smoothrng(src, per, mult)
// Range Filter
rngfilt(x, r) =>
rngfilt = x
rngfilt := x > nz(rngfilt[1]) ? x - r < nz(rngfilt[1]) ? nz(rngfilt[1]) : x - r :
x + r > nz(rngfilt[1]) ? nz(rngfilt[1]) : x + r
rngfilt
filt = rngfilt(src, smrng)
// Filter Direction
upward = 0.0
upward := filt > filt[1] ? nz(upward[1]) + 1 : filt < filt[1] ? 0 : nz(upward[1])
downward = 0.0
downward := filt < filt[1] ? nz(downward[1]) + 1 : filt > filt[1] ? 0 : nz(downward[1])
// Target Bands
hband = filt + smrng
lband = filt - smrng
// Colors
filtcolor = upward > 0 ? upColor : downward > 0 ? downColor : midColor
barcolor = src > filt and src > src[1] and upward > 0 ? upColor :
src > filt and src < src[1] and upward > 0 ? upColor :
src < filt and src < src[1] and downward > 0 ? downColor :
src < filt and src > src[1] and downward > 0 ? downColor : midColor
filtplot = plot(filt, color=filtcolor, linewidth=2, title="Range Filter")
// Target
hbandplot = plot(hband, color=color.new(upColor, 70), title="High Target")
lbandplot = plot(lband, color=color.new(downColor, 70), title="Low Target")
// Fills
fill(hbandplot, filtplot, color=color.new(upColor, 90), title="High Target Range")
fill(lbandplot, filtplot, color=color.new(downColor, 90), title="Low Target Range")
// Bar Color
barcolor(barcolor)
// Break Outs
longCond = bool(na)
shortCond = bool(na)
longCond := src > filt and src > src[1] and upward > 0 or
src > filt and src < src[1] and upward > 0
shortCond := src < filt and src < src[1] and downward > 0 or
src < filt and src > src[1] and downward > 0
CondIni = 0
CondIni := longCond ? 1 : shortCond ? -1 : CondIni[1]
longCondition = longCond and CondIni[1] == -1
shortCondition = shortCond and CondIni[1] == 1
//Alerts
plotshape(longCondition, title="Buy Signal", text="Buy", textcolor=color.white, style=shape.labelup, size=size.small, location=location.belowbar, color=color.new(#aaaaaa, 20))
plotshape(shortCondition, title="Sell Signal", text="Sell", textcolor=color.white, style=shape.labeldown, size=size.small, location=location.abovebar, color=color.new(downColor, 20))
alertcondition(longCondition, title="Buy alert on Range Filter", message="Buy alert on Range Filter")
alertcondition(shortCondition, title="Sell alert on Range Filter", message="Sell alert on Range Filter")
alertcondition(longCondition or shortCondition, title="Buy and Sell alert on Range Filter", message="Buy and Sell alert on Range Filter")
- 1. KakaoTalk_20241218_234538044.jpg (0.11 MB)
답변 1

예스스탁 예스스탁 답변
2024-12-19 13:54:01
안녕하세요
예스스탁입니다.
input : per(100),mult(3.0);
var : upcolor(Red),midcolor(Green),downcolor(Blue);
var : src(0),filt(0),t(0),tx(0);
src = close;
var : wper(0),avrng(0),smrng(0);
var : upward(0),downward(0),hband(0),lband(0),filtcolor(0);
wper = per * 2 - 1;
avrng = ema(abs(src - src[1]), per);
smrng = ema(avrng, wper) *mult;
filt = src;
filt = iff(src > IFf(isnan(filt[1])==true,0,filt[1]),
iff(src - smrng < IFf(isnan(filt[1])==true,0,filt[1]), IFf(isnan(filt[1])==true,0,filt[1]) , src - smrng),
iff(src + smrng > IFf(isnan(filt[1])==true,0,filt[1]), IFf(isnan(filt[1])==true,0,filt[1]) , src + smrng));
// Filter Direction
upward = 0.0;
upward = iff(filt > filt[1] , iff(IsNan(upward[1])==true,0,upward[1]) + 1 ,IFf(filt < filt[1] , 0 , iff(IsNan(upward[1])==true,0,upward[1])));
downward = 0.0;
downward = iff(filt < filt[1] , iff(IsNan(downward[1])==true,0,downward[1])+ 1 ,IFf(filt > filt[1] , 0 , iff(IsNan(downward[1])==true,0,downward[1])));
// Target Bands
hband = filt + smrng;
lband = filt - smrng;
// Colors
filtcolor = iff(upward > 0 , upColor , IFf(downward > 0 , downColor , midColor));
plot1(filt,"Range Filter",filtcolor);
plot2(hband,"High Target",upColor);
plot3(lband,"Low Target",downColor);
if (src > filt and src > src[1] and upward > 0) or (src > filt and src < src[1] and upward > 0) Then
T = 1;
if (src < filt and src < src[1] and downward > 0) or (src < filt and src > src[1] and downward > 0) Then
T = -1;
if T == 1 and T != T[1] Then
{
tx = Text_New(sDate,sTime,L,"▲");
Text_SetColor(tx,upColor);
Text_SetStyle(tx,2,0);
}
if T == -1 and T != T[1] Then
{
tx = Text_New(sDate,sTime,H,"▼");
Text_SetColor(tx,downColor);
Text_SetStyle(tx,2,0);
}
즐거운 하루되세요
> 비듬싸순 님이 쓴 글입니다.
> 제목 : 수고하십니다
>
항상 노고에 감사드리며
변환 부탁드립니다
indicator(title="Range Filter Buy and Sell 5min", shorttitle="Range Filter", overlay=true)
// Color variables
upColor = color.white
midColor = #90bff9
downColor = color.blue
// Source
src = input(defval=close, title="Source")
// Sampling Period
// Settings for 5min chart, BTCUSDC. For Other coin, change the paremeters
per = input.int(defval=100, minval=1, title="Sampling Period")
// Range Multiplier
mult = input.float(defval=3.0, minval=0.1, title="Range Multiplier")
// Smooth Average Range
smoothrng(x, t, m) =>
wper = t * 2 - 1
avrng = ta.ema(math.abs(x - x[1]), t)
smoothrng = ta.ema(avrng, wper) * m
smoothrng
smrng = smoothrng(src, per, mult)
// Range Filter
rngfilt(x, r) =>
rngfilt = x
rngfilt := x > nz(rngfilt[1]) ? x - r < nz(rngfilt[1]) ? nz(rngfilt[1]) : x - r :
x + r > nz(rngfilt[1]) ? nz(rngfilt[1]) : x + r
rngfilt
filt = rngfilt(src, smrng)
// Filter Direction
upward = 0.0
upward := filt > filt[1] ? nz(upward[1]) + 1 : filt < filt[1] ? 0 : nz(upward[1])
downward = 0.0
downward := filt < filt[1] ? nz(downward[1]) + 1 : filt > filt[1] ? 0 : nz(downward[1])
// Target Bands
hband = filt + smrng
lband = filt - smrng
// Colors
filtcolor = upward > 0 ? upColor : downward > 0 ? downColor : midColor
barcolor = src > filt and src > src[1] and upward > 0 ? upColor :
src > filt and src < src[1] and upward > 0 ? upColor :
src < filt and src < src[1] and downward > 0 ? downColor :
src < filt and src > src[1] and downward > 0 ? downColor : midColor
filtplot = plot(filt, color=filtcolor, linewidth=2, title="Range Filter")
// Target
hbandplot = plot(hband, color=color.new(upColor, 70), title="High Target")
lbandplot = plot(lband, color=color.new(downColor, 70), title="Low Target")
// Fills
fill(hbandplot, filtplot, color=color.new(upColor, 90), title="High Target Range")
fill(lbandplot, filtplot, color=color.new(downColor, 90), title="Low Target Range")
// Bar Color
barcolor(barcolor)
// Break Outs
longCond = bool(na)
shortCond = bool(na)
longCond := src > filt and src > src[1] and upward > 0 or
src > filt and src < src[1] and upward > 0
shortCond := src < filt and src < src[1] and downward > 0 or
src < filt and src > src[1] and downward > 0
CondIni = 0
CondIni := longCond ? 1 : shortCond ? -1 : CondIni[1]
longCondition = longCond and CondIni[1] == -1
shortCondition = shortCond and CondIni[1] == 1
//Alerts
plotshape(longCondition, title="Buy Signal", text="Buy", textcolor=color.white, style=shape.labelup, size=size.small, location=location.belowbar, color=color.new(#aaaaaa, 20))
plotshape(shortCondition, title="Sell Signal", text="Sell", textcolor=color.white, style=shape.labeldown, size=size.small, location=location.abovebar, color=color.new(downColor, 20))
alertcondition(longCondition, title="Buy alert on Range Filter", message="Buy alert on Range Filter")
alertcondition(shortCondition, title="Sell alert on Range Filter", message="Sell alert on Range Filter")
alertcondition(longCondition or shortCondition, title="Buy and Sell alert on Range Filter", message="Buy and Sell alert on Range Filter")
다음글
이전글