커뮤니티
그물망 지표

2010-11-11 09:03:28
1523
글번호 33506
첨부 이미지
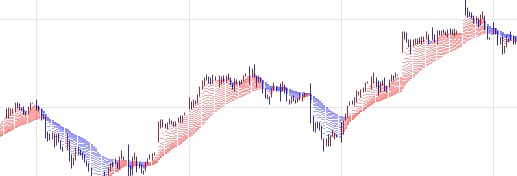
그림1

아래 그물망 지표를 상승할 때는 빨강색
하락 할 때는 파랑색으로 나오게 해 주십시요
첨부한 그림과 같이 나오게 부탁합니다.
감사합니다. 좋은 하루 되세요
input : P(20),간격(5);
array : mav[12](0);
mav[1] = ma(c,P+간격*1);
mav[2] = ma(c,P+간격*2);
mav[3] = ma(c,P+간격*3);
mav[4] = ma(c,P+간격*4);
mav[5] = ma(c,P+간격*5);
mav[6] = ma(c,P+간격*6);
mav[7] = ma(c,P+간격*7);
mav[8] = ma(c,P+간격*8);
mav[9] = ma(c,P+간격*9);
mav[10] = ma(c,P+간격*10);
mav[11] = ma(c,P+간격*11);
mav[12] = ma(c,P+간격*12);
- 1. 그물망.jpg (0.02 MB)
답변 1

예스스탁 예스스탁 답변
2010-11-11 10:15:02
안녕하세요
예스스탁입니다.
input : P(20),간격(5);
array : mav[12](0);
mav[1] = ma(c,P+간격*1);
mav[2] = ma(c,P+간격*2);
mav[3] = ma(c,P+간격*3);
mav[4] = ma(c,P+간격*4);
mav[5] = ma(c,P+간격*5);
mav[6] = ma(c,P+간격*6);
mav[7] = ma(c,P+간격*7);
mav[8] = ma(c,P+간격*8);
mav[9] = ma(c,P+간격*9);
mav[10] = ma(c,P+간격*10);
mav[11] = ma(c,P+간격*11);
mav[12] = ma(c,P+간격*12);
plot1(mav[1],"1",iff(mav[1] > mav[1][1],red,blue));
plot2(mav[2],"2",iff(mav[2] > mav[2][1],red,blue));
plot3(mav[3],"3",iff(mav[3] > mav[3][1],red,blue));
plot4(mav[4],"4",iff(mav[4] > mav[4][1],red,blue));
plot5(mav[5],"5",iff(mav[5] > mav[5][1],red,blue));
plot6(mav[6],"6",iff(mav[6] > mav[6][1],red,blue));
plot7(mav[7],"7",iff(mav[7] > mav[7][1],red,blue));
plot8(mav[8],"8",iff(mav[8] > mav[8][1],red,blue));
plot9(mav[9],"9",iff(mav[9] > mav[9][1],red,blue));
plot10(mav[10],"10",iff(mav[10] > mav[10][1],red,blue));
plot11(mav[11],"11",iff(mav[11] > mav[11][1],red,blue));
plot12(mav[12],"12",iff(mav[12] > mav[12][1],red,blue));
즐거운 하루되세요
> 동해바다01 님이 쓴 글입니다.
> 제목 : 그물망 지표
> 아래 그물망 지표를 상승할 때는 빨강색
하락 할 때는 파랑색으로 나오게 해 주십시요
첨부한 그림과 같이 나오게 부탁합니다.
감사합니다. 좋은 하루 되세요
input : P(20),간격(5);
array : mav[12](0);
mav[1] = ma(c,P+간격*1);
mav[2] = ma(c,P+간격*2);
mav[3] = ma(c,P+간격*3);
mav[4] = ma(c,P+간격*4);
mav[5] = ma(c,P+간격*5);
mav[6] = ma(c,P+간격*6);
mav[7] = ma(c,P+간격*7);
mav[8] = ma(c,P+간격*8);
mav[9] = ma(c,P+간격*9);
mav[10] = ma(c,P+간격*10);
mav[11] = ma(c,P+간격*11);
mav[12] = ma(c,P+간격*12);