커뮤니티
결과값이 다릅니다.

2011-08-03 01:52:28
1186
글번호 205217
첨부 이미지
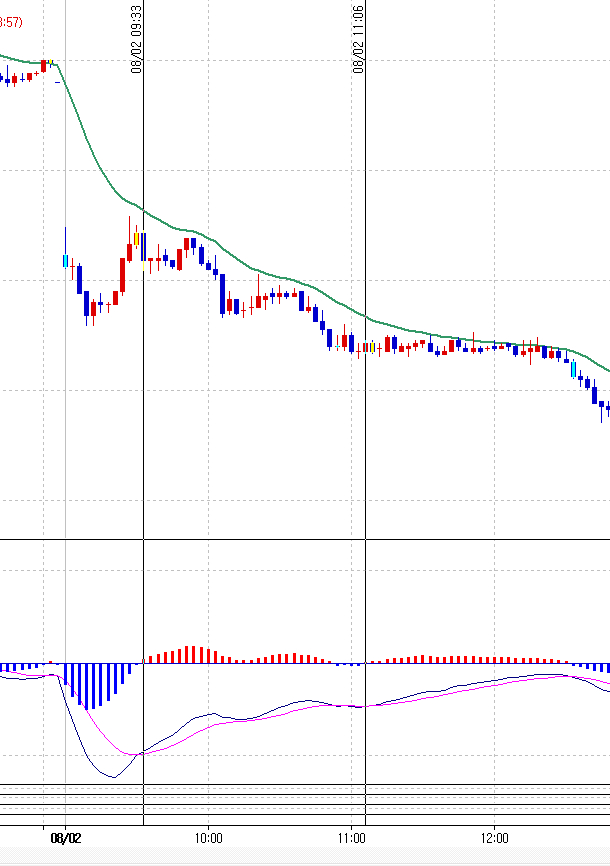
그림1

우선 5069번의 마지막 질문에 답변 부탁드리겠습니다.
추가 질문 드립니다.
아래 두식은 보시면 아시겠지만, MACD를 지표식과 강조식으로 표현했습니다.
(아래 두식은 일부만 추출한것이 아니고 식의 전부입니다.)
로직은 MACD OSC가 0을 교차하면 배열에 그 시점의 고가와 저가를 넣게됩니다.
그 시점을 눈으로 쉽게 확인하기 위해 강조식으로 다시 만들어 본차트에 적용시켰습니다.
그런데 결과가 다른 부분이 있어 원인을 알고 싶어 문의 드립니다.
2011/08/02 09:33:00 MACD OSC가 0을 상향돌파하기전 강조에는 돌파되었다고 표시됨.
2011/08/02 11:06:00 MACD OSC가 0을 상향돌파한 다음봉에 돌파되었다고 표시됨.
2011/07/01 11:27:00 MACD OSC가 0을 돌파하지 않았음에도 돌파되었다고 표시됨.
2011/07/01 11:30:00 11:27:00증상과 동일
***사용된 MACD 지표식
value = MACD(shortPeriod, longPeriod); // shortPeriod:12 longPeriod:24
macdosc = value-ema(value,Period); // Period : 9
Plot1(value, "MACD");
Plot2(ema(value,Period), "MACDSignal");
counter = 0;
If CrossUp(macdosc,0) OR CrossDown(macdosc,0) Then
{
For counter = 0 to 49
{
MV[ 0 , 50 - Counter ] = MV[ 0 , 49 - Counter ];
MV[ 1 , 50 - Counter ] = MV[ 1 , 49 - Counter ];
MV[ 2 , 50 - Counter ] = MV[ 2 , 49 - Counter ];
}
MV[ 0 , 0 ] = Index;
MV[ 1, 0 ] = High;
MV[ 2, 0 ] = Low;
MessageLog("%.2f, %.2f, %.2f", macdosc, MV[ 1 , 0 ],MV[ 2 , 0 ]);
}
if macdosc > 0 then plot3(mscdosc, "MACDOscillator", RED);
else Plot3(value1, "MACDOscillator", BLUE);
PlotBaseLine1(0, "기준선1");
*** 위 식의 강조식
value = MACD(shortPeriod, longPeriod); // shortPeriod:12 longPeriod:24
macdosc = value-ema(value,Period); // Period : 9
Plot1(value, "MACD");
Plot2(ema(value,Period), "MACDSignal");
counter = 0;
If CrossUp(macdosc,0) OR CrossDown(macdosc,0) Then
{
For counter = 0 to 49
{
MV[ 0 , 50 - Counter ] = MV[ 0 , 49 - Counter ];
MV[ 1 , 50 - Counter ] = MV[ 1 , 49 - Counter ];
MV[ 2 , 50 - Counter ] = MV[ 2 , 49 - Counter ];
}
MV[ 0 , 0 ] = Index;
MV[ 1, 0 ] = High;
MV[ 2, 0 ] = Low;
MessageLog("%.2f, %.2f, %.2f", macdosc, MV[ 1 , 0 ],MV[ 2 , 0 ]);
}
if crossup(macdosc,0) then PlotPaintBar(close,open,"aa",yellow);
if crossdown(macdosc,0) then PlotPaintBar(close,open,"aa",cyan);
- 1. 2011-08-03_014527.jpg (0.18 MB)
답변 1

예스스탁 예스스탁 답변
2011-08-03 09:33:30
안녕하세요? 예스스탁입니다.
올리신 식으로 다시 작성해서 테스트 해보았는데, 두 개의 시점이 정확히 일치합니다. 지표식에서 값을 잘못 대입한 부분이 있는것 같습니다.
지표식과 강조식 다시 올려 드립니다.
먼저 올려주신 내용은 확인후 답변 드리도록 하겠습니다.
[지표식]
input : shortperiod(12), longPeriod(26), period(9);
var : macdosc(0), counter(0);
Array : MV[100,100](0);
value1 = MACD(shortPeriod, longPeriod); // shortPeriod:12 longPeriod:24
macdosc = value1-ema(value1,Period); // Period : 9
Plot1(value1, "MACD");
Plot2(ema(value1,Period), "MACDSignal");
counter = 0;
If CrossUp(macdosc,0) OR CrossDown(macdosc,0) Then
{
For counter = 0 to 49
{
MV[ 0 , 50 - Counter ] = MV[ 0 , 49 - Counter ];
MV[ 1 , 50 - Counter ] = MV[ 1 , 49 - Counter ];
MV[ 2 , 50 - Counter ] = MV[ 2 , 49 - Counter ];
}
MV[ 0 , 0 ] = Index;
MV[ 1, 0 ] = High;
MV[ 2, 0 ] = Low;
//MessageLog("%.2f, %.2f, %.2f", macdosc, MV[ 1 , 0 ],MV[ 2 , 0 ]);
}
if macdosc > 0 then
plot3(macdosc, "MACDOscillator", RED);
else
Plot3(macdosc, "MACDOscillator", BLUE);
PlotBaseLine1(0, "기준선1");
[강조식]
input : shortperiod(12), longPeriod(26), period(9);
var : macdosc(0), counter(0);
Array : MV[100,100](0);
value1 = MACD(shortPeriod, longPeriod); // shortPeriod:12 longPeriod:24
macdosc = value1-ema(value1,Period); // Period : 9
/*Plot1(value1, "MACD");
Plot2(ema(value1,Period), "MACDSignal");*/
counter = 0;
If CrossUp(macdosc,0) OR CrossDown(macdosc,0) Then
{
For counter = 0 to 49
{
MV[ 0 , 50 - Counter ] = MV[ 0 , 49 - Counter ];
MV[ 1 , 50 - Counter ] = MV[ 1 , 49 - Counter ];
MV[ 2 , 50 - Counter ] = MV[ 2 , 49 - Counter ];
}
MV[ 0 , 0 ] = Index;
MV[ 1, 0 ] = High;
MV[ 2, 0 ] = Low;
//MessageLog("%.2f, %.2f, %.2f", macdosc, MV[ 1 , 0 ],MV[ 2 , 0 ]);
}
if crossup(macdosc,0) then PlotPaintBar(close,open,"aa",yellow);
if crossdown(macdosc,0) then PlotPaintBar(close,open,"aa",cyan);